 Skip to Navigation
Monitoring: Disk I/O Performance Monitor
It is possible to track I/O rates in RavenDB using the Monitor tool.
To get the Monitor tool you need to download RavenDB's ZIP package from the download page The tool is located in the extracted ZIP package in the folder: \Raven.Monitor\bin\Debug\Raven.Monitor.exe
First, make sure there is a server instance running locally.
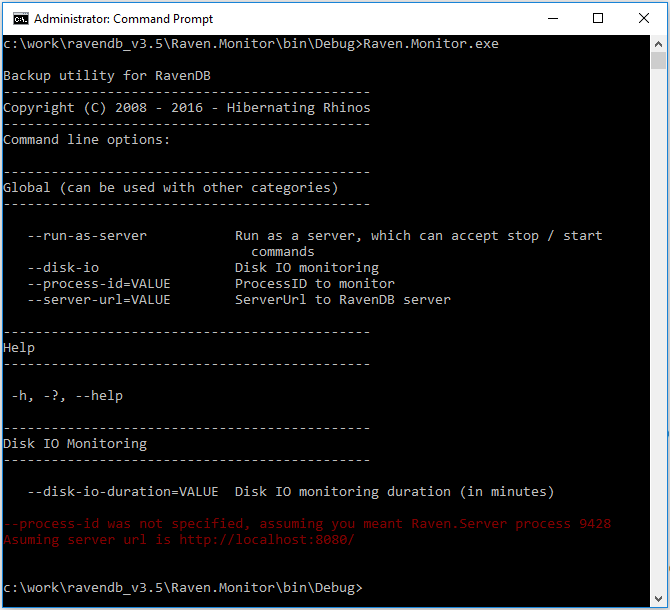
Then open cmd as administrator and run Raven.Monitor.exe without specifying options to see the help menu.
To start monitoring run:
Raven.Monitor.exe --disk-io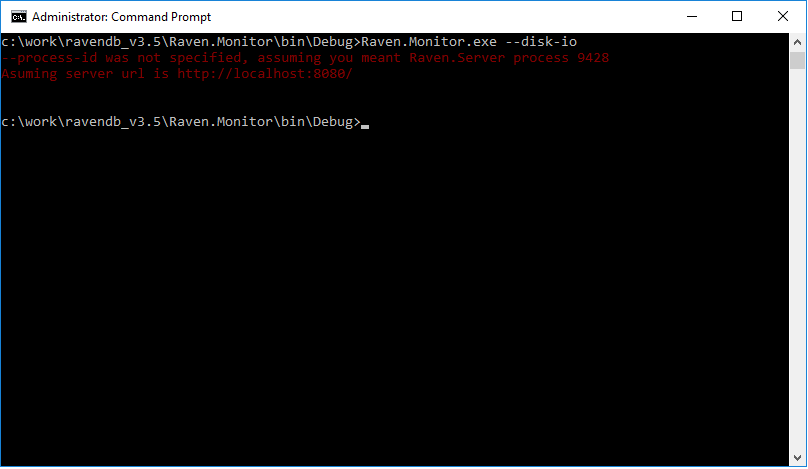
You can also specify a different process or server URL.
The default monitoring time is 60 seconds.
If you'd like to control the duration or do it remotely you can run the monitor as a server:
Raven.Monitor.exe --run-as-server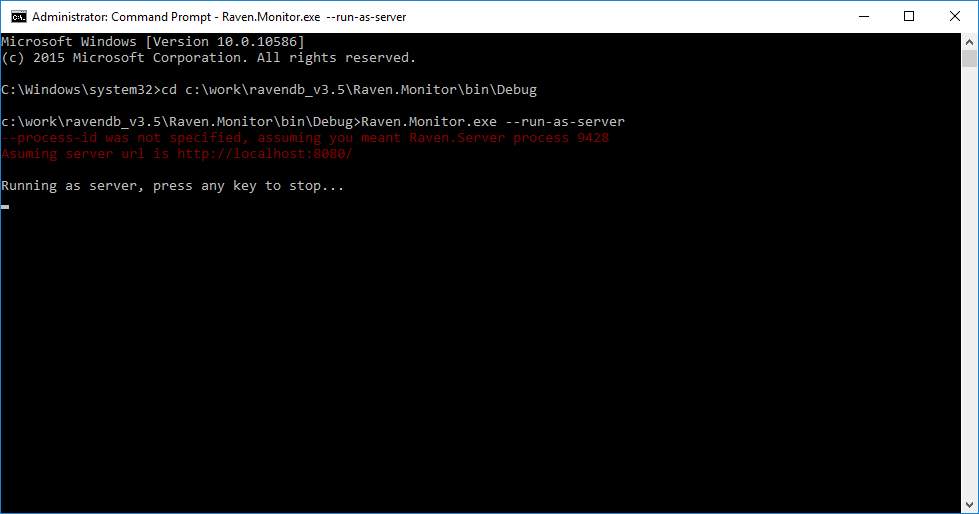
Now the monitor is listening to port 9091 and can accept the following REST calls:
http://localhost:9091/monitor/start-monitoring
http://localhost:9091/monitor/stop-monitoring
While the monitor is running you can run your database scenario. When you're done recording, you can view the report in the studio.