 Skip to Navigation
Query: Reporting View
This view allows to perform report queries on results of existing indexes. Under the hood it works based on Dynamic aggregation feature.
Action Bar
Action Bar consists of the following:
Select the index- first you need to choose an index you want to report on,Run the report- runs the report on the selected index for a given aggregation values,Edit the index- enables to edit a definition of the selected index by navigating to Index Edit View,Export to CSV- Export the report to CSV file,Cache- Enable/Disable caching option.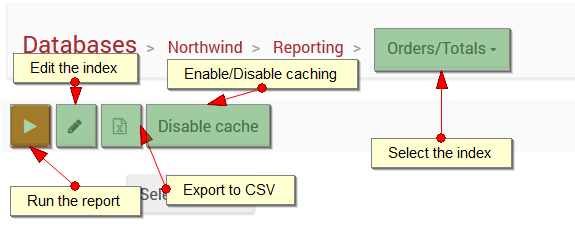
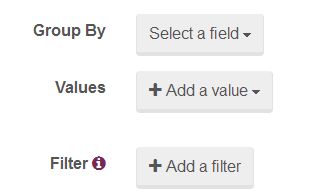
Aggregation criteria
Group By- name of a field that the report will aggregate by the index results,Values- names of fields that will be processed by reportFilter- filtering criteria
Issuing reporting query - example
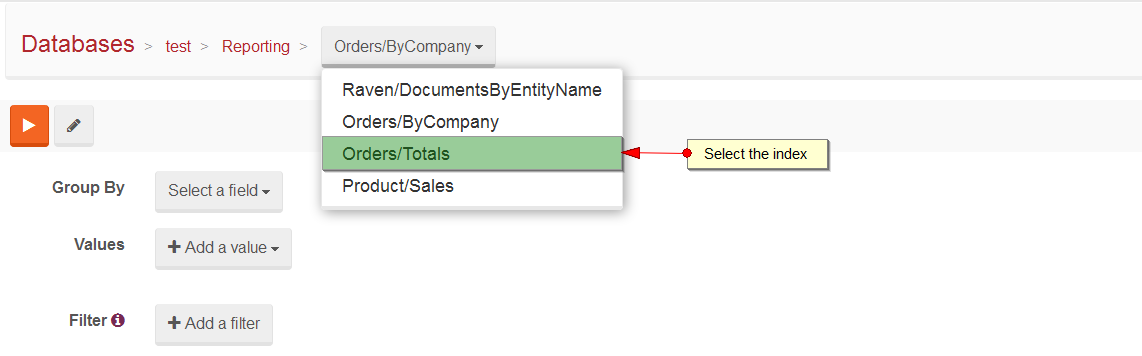
The first step is selecting the appropriate index:
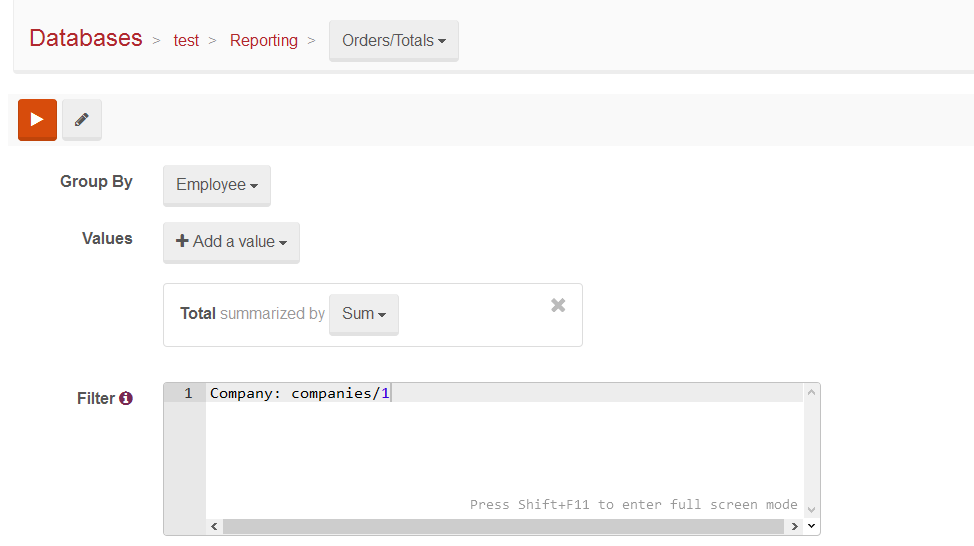
Next fill the aggregation criteria:
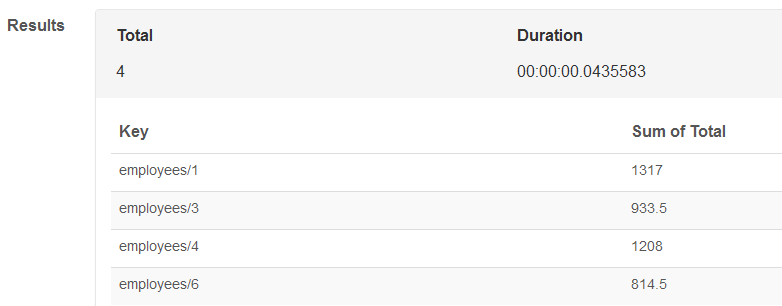
Then run the report. You will see the results:
This is equivalent of doing:
select EmployeeID, sum(tot.Total) Total from Orders o join
    (
        select sum((Quantity * UnitPrice) * (1- Discount)) Total, OrderId from [Order Details]
        group by OrderID
    ) tot
    on o.OrderID = tot.OrderID
where o.CustomerID = @CustomerId
group by EmployeeID
In code, this would look something like this:
session.Query<Order>("Orders/Total")
	.Where(x => x.Company == "companies/1")
	.AggregateBy(x => x.Employee)
	.SumOn(x => x.Total)
	.ToList();