Skip to Navigation
Database Health and Server Monitoring
How to monitor your database health and server, using RavenDB’s tools and instrumentation to proactively avoid issues.
Throughout this series we’ve focused on strategies that will help your application remain highly available in the event of a disaster.
In this article, we’ll cover how to monitor your database health to proactively avoid issues that could lead to disaster. RavenDB provides a host of tools and instrumentation out-of-the-box that let you monitor server and database health.
Table of contents
Monitoring in RavenDB Studio
One of the massive benefits with RavenDB is its first-class administrative Studio interface which offers a host of dashboards and tools that allow you to see both high- and low-level information about your cluster or server.
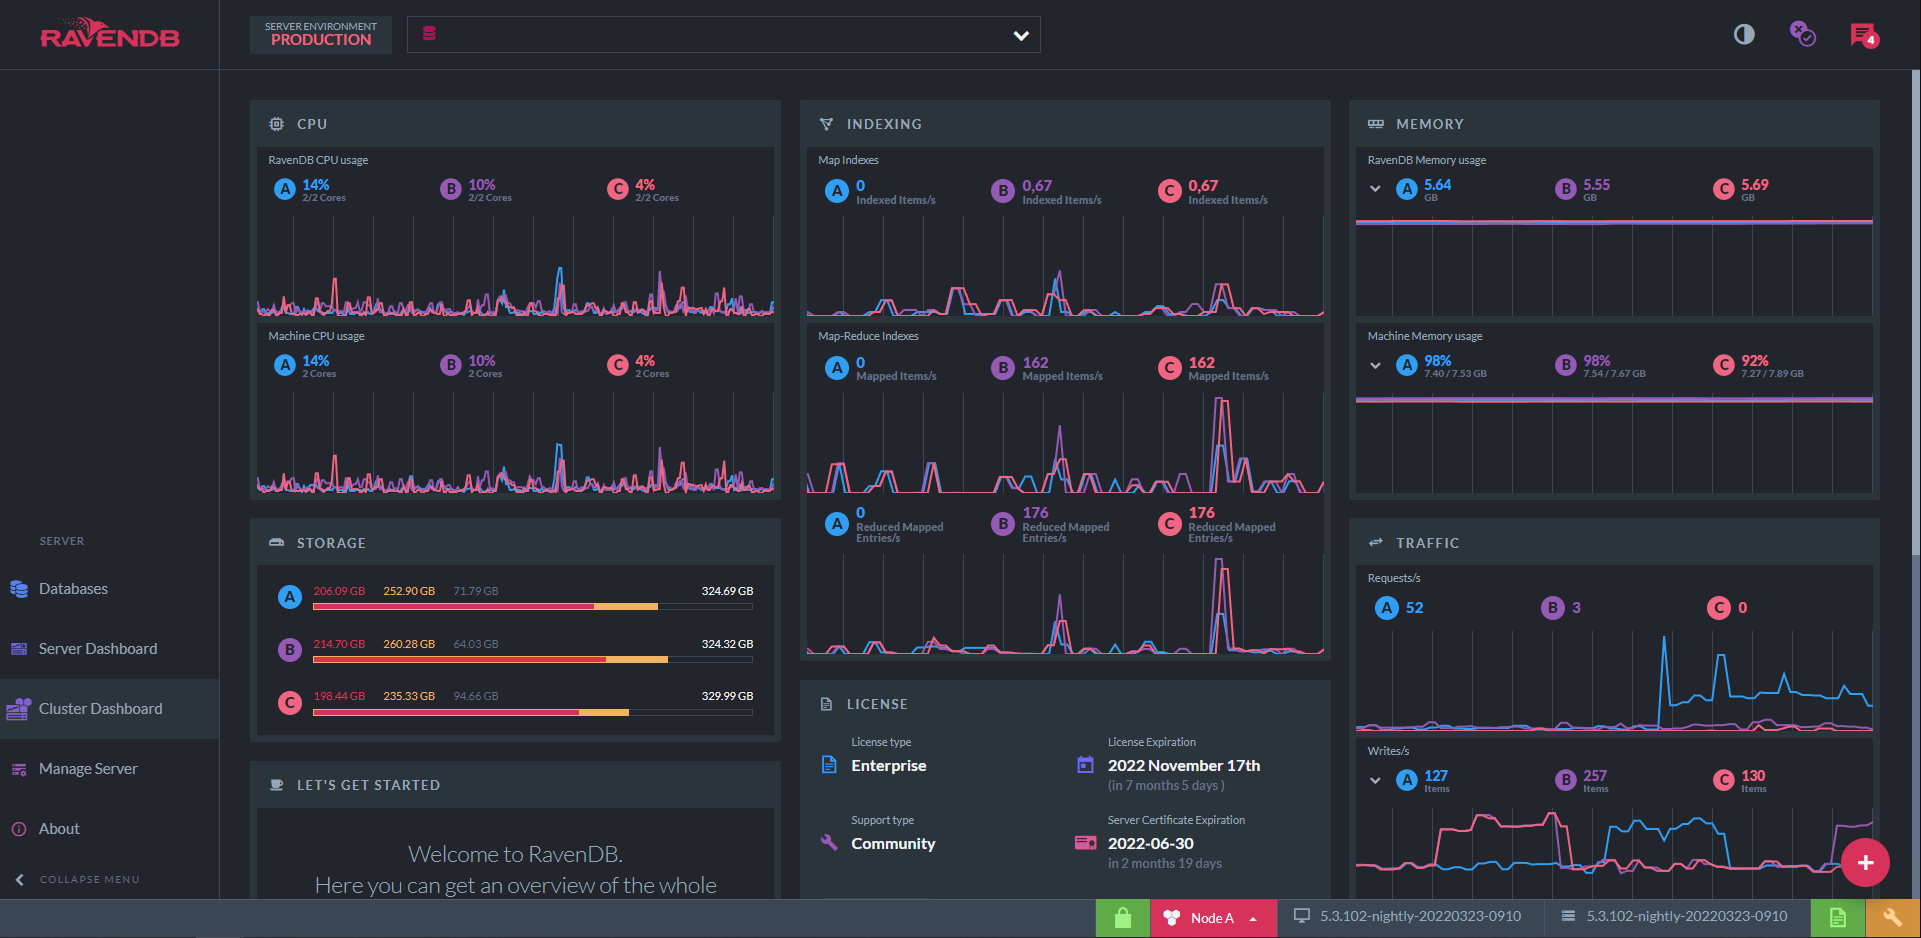
Server and Cluster Studio Dashboards
Built-in for all RavenDB licenses is the Studio interface that provides access to both server and cluster dashboards. These high-level dashboards provide a zero-install experience that makes it easy to see at a glance what’s happening within a single server or across your cluster.
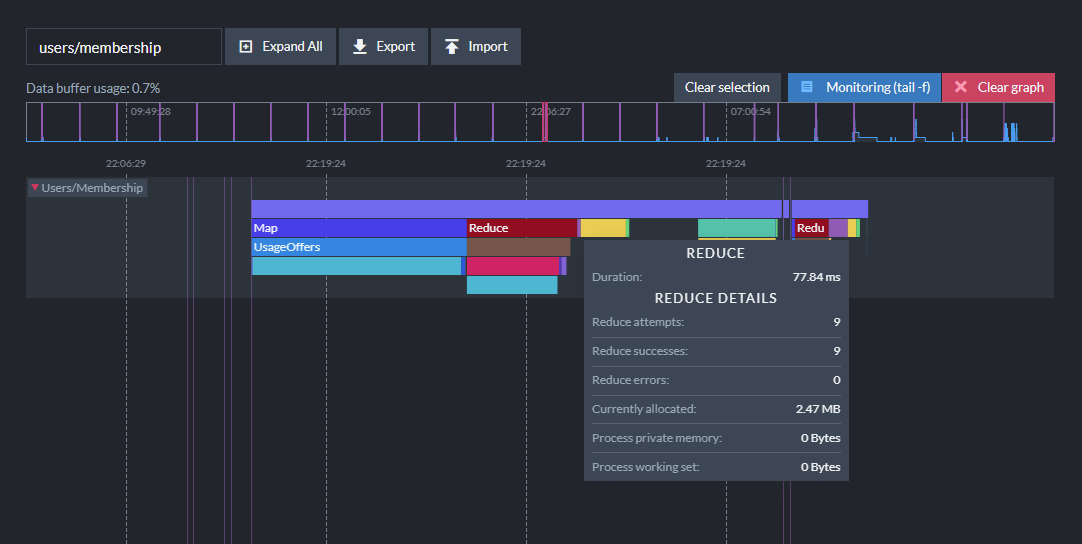
Viewing Index Performance
Indexing operations run in the background as documents are processed. Using the Indexing Performance view you can examine in detail how documents are being mapped, reduced, and how long things are taking to diagnose issues.
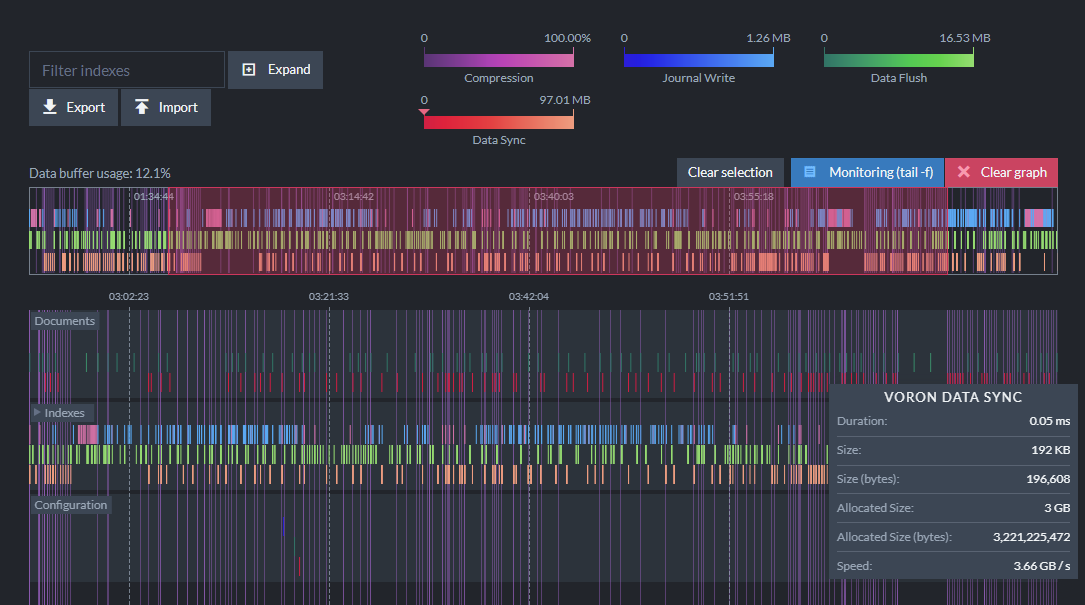
Viewing I/O Usage
Under the Stats menu for a database, you can see how RavenDB is performing I/O operations under the hood in great detail. These stats are available at both the server and database level.
The I/O Stats view provides insight into the low-level operations of the Voron engine to diagnose potential disk performance issues:
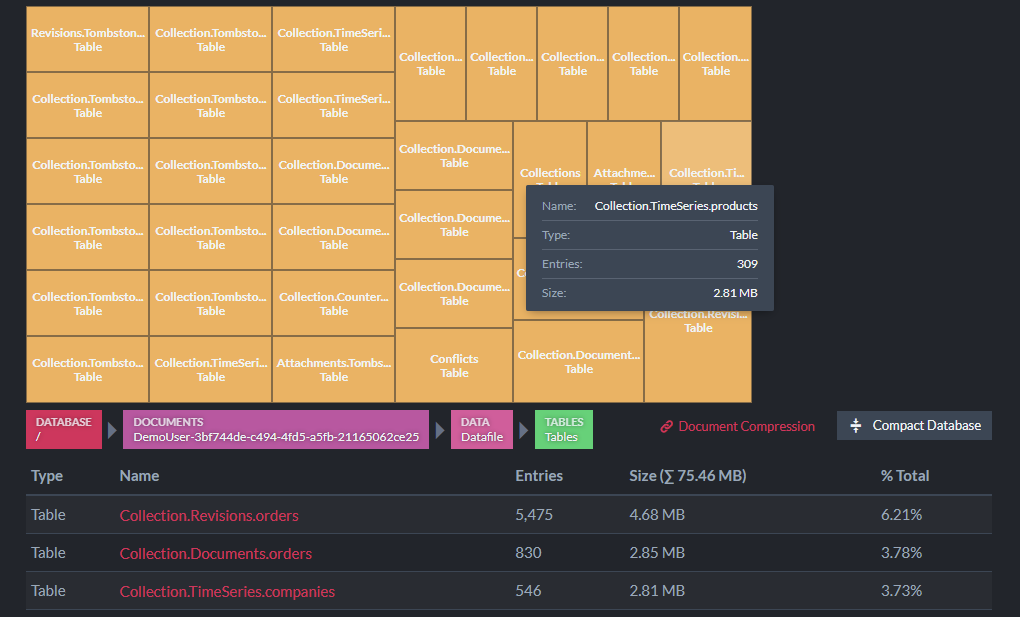
The Storage Report view will tell you the size of collections, indexes, and how storage is being used:
Viewing Query and Request Traffic
Using the Traffic View under the Manage Server menu will let you see the live requests coming into the database to see which queries are being executed:

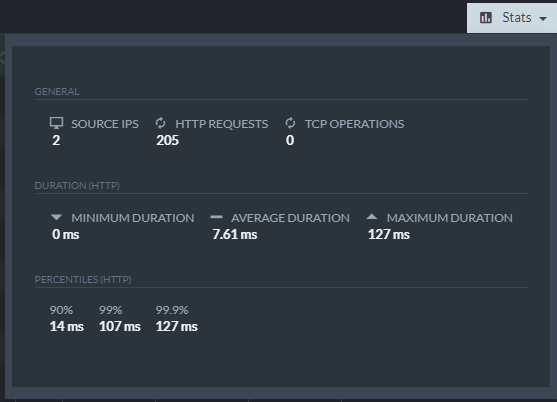
The Running Queries view lets you see if there are any long-running queries being processed by RavenDB. You can filter by operation type and you can also view aggregate statistics for watched traffic:
Viewing Admin Logs
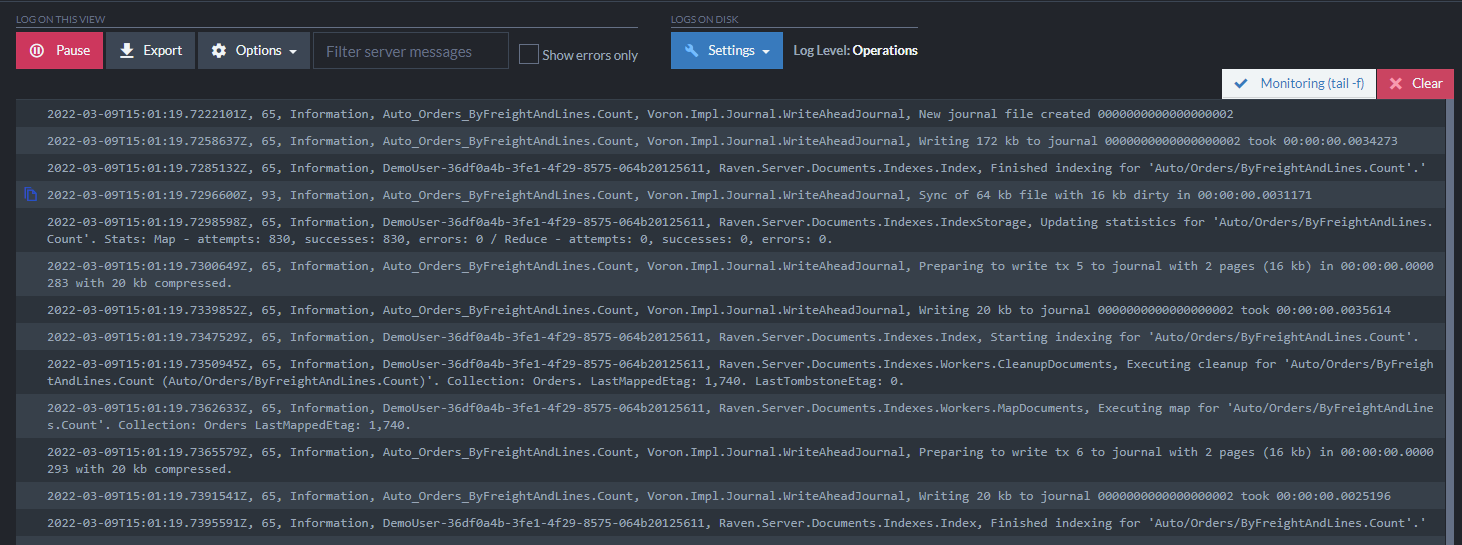
The Admin Logs view under the Server Dashboard allows you to filter and tail real-time logging for active incidents or to diagnose issues:
Viewing Advanced Stats
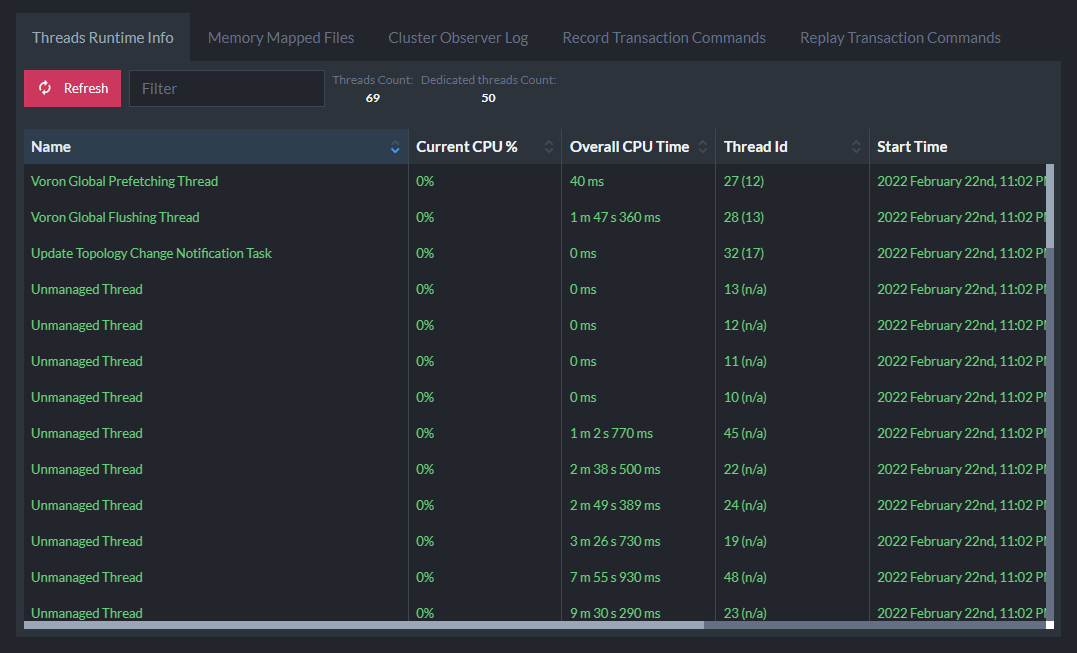
For low-level information relating to worker threads, memory mapped files, and cluster observer log, under the Manage Server menu you can also find the Advanced view. This view can be useful for understanding CPU usage for each index or other tasks in your database.
Viewing Stack Traces
The Stack Traces advanced view will let you capture the RavenDB server threading stack trace for debugging, including CPU usage per thread. This can help you understand thread utilization at a granular level, and what threads are running on your server.
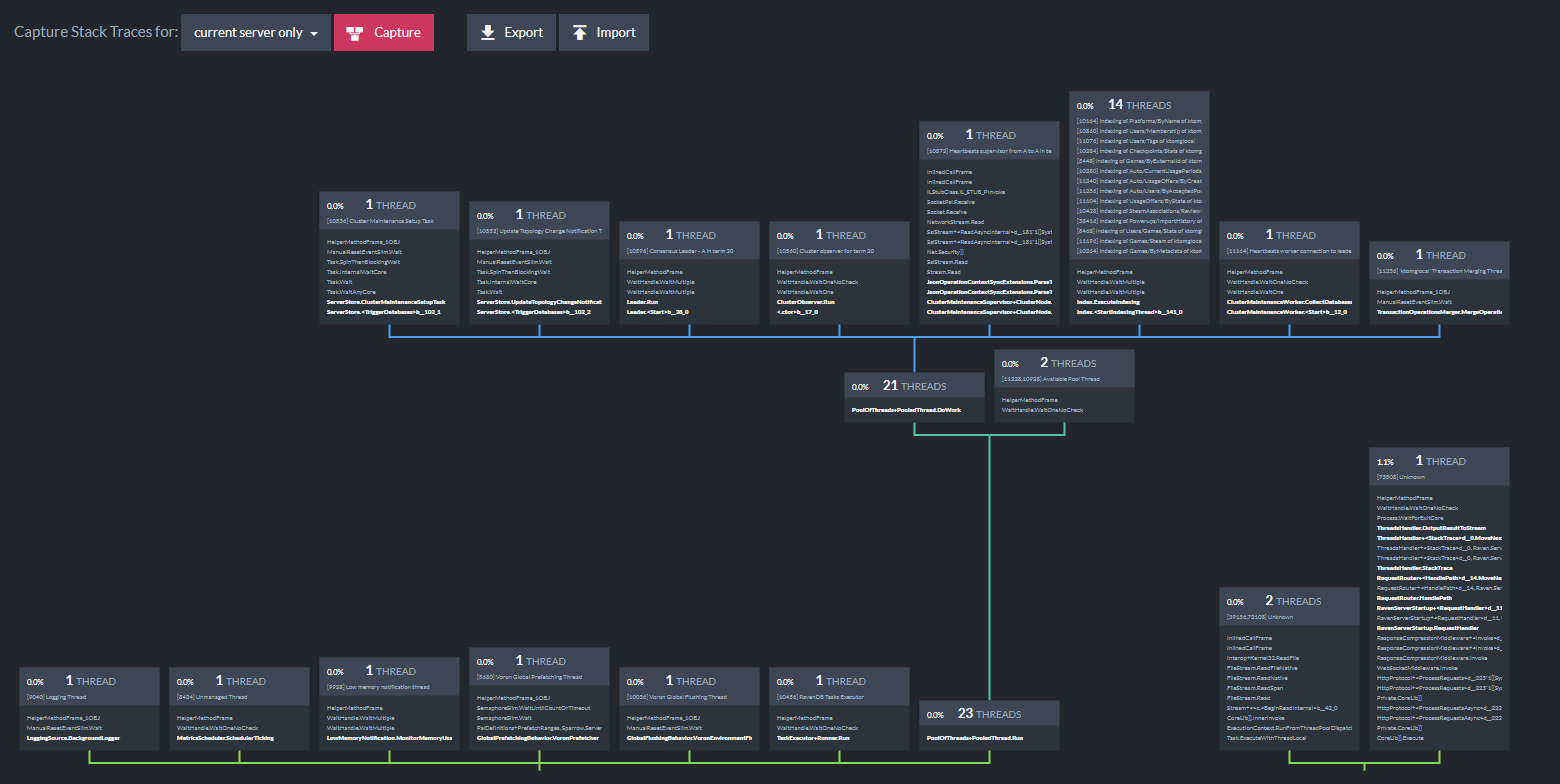
You can capture a snapshot for a single server or entire cluster and export/import the files to visualize.
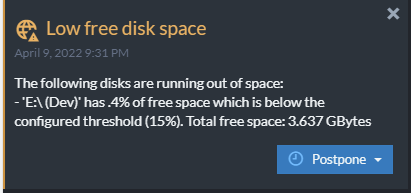
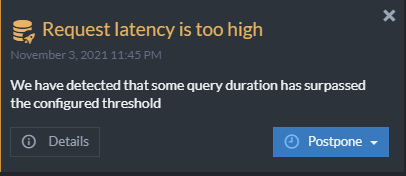
Viewing Notifications
In RavenDB Studio, the Notification Center surfaces messages that warn when disk space is low, if indexes are performing poorly, and generally helps you anticipate problems before they become production issues.
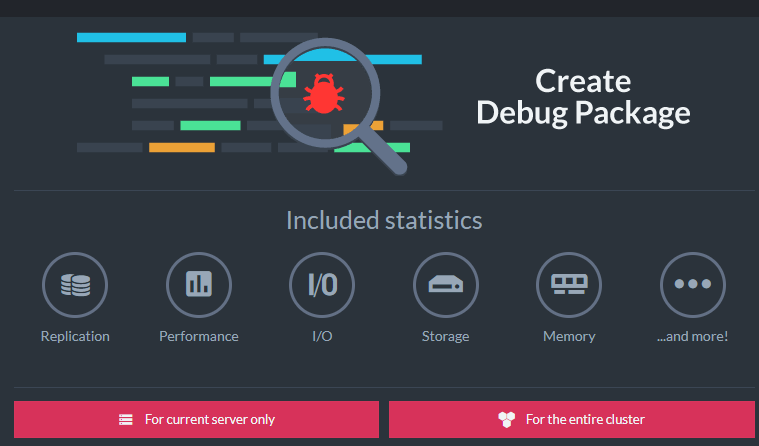
Create an Offline Debug Package
Under the Debug menu of a server, you can choose the “Gather debug info” option to generate a zip file. This is useful when needing to capture a snapshot of database state for later debugging, such as when taking action to fix a node. It is often used in support scenarios to send to the RavenDB team for analysis or during live calls.
Monitoring Outside RavenDB
The Studio interface provides detailed database monitoring views of how a server and cluster are performing in real-time for operations teams but it is more likely large installations of RavenDB will require more observability and automation.
Nearly all aspects of RavenDB are exhaustively instrumented and you can ship those metrics to external systems to provide robust enterprise-level support for monitoring and alerting.
Telegraf Plugin Integration
RavenDB also offers the ability to ship metrics to tools like Grafana, Prometheus, and many others so you can design rich dashboards using the RavenDB Telegraf plugin. This can be used with any license including the free Community license.
A starting Grafana dashboard is available that will set up a useful default set of charts and graphs to monitor your cluster. Grafana offers many advanced monitoring features like threshold alerting and you can send notifications to your phone, email, or Slack.

Simple Network Management Protocol (SNMP) Support
At scale, when you have many instances of RavenDB, SNMP can be used with tools like Zabbix, Datadog, and PRTG to provide a holistic monitoring solution for all of your clusters. RavenDB exposes all its internal details through SNMP which is supported for enterprise licenses.
Debug and Stats REST Endpoints
RavenDB also exposes debug endpoints and stats endpoints for each server node. These can be used by custom tools to build custom dashboards or fetch metrics from the server.
What Should You Monitor?
If you created a dashboard that contained all the metrics RavenDB has to offer it wouldn’t be very useful. It would be hard to understand what may be cause for concern versus an actual issue.
Start with the Default Template
It is impossible to provide specific advice for your scenario but there are some metrics that most installations of RavenDB will want to track. There is a Grafana dashboard that can be used with Telegraf to start with.
Monitor Your Leading Indicators
Instead of tracking everything, it’s recommended to start by identifying your “leading indicators.” These are metrics that will warn you to prevent potential service degradation. For example, if the normal request traffic pattern is more random, with spikes of CPU usage, then having sustained high CPU usage would indicate a potential issue to investigate.
Recommended RavenDB Metrics
The following SNMP metrics are what we recommend for you to monitor. These are some of the out-of-the-box metrics RavenDB cloud monitors for you.
When interpreting the OID strings, you will see letters like D which is the database number and I which is the index number.
Number of Database Alerts
RavenDB will surface alerts in the Notification Center for a database. These alerts are exposed and should be monitored. Database alerts surface immediate issues that should be addressed as they might be affecting requests or availability.
In SNMP, the OID 5.2.D.1.10 (“Number of alerts”) can be monitored.
Number of Failures
In addition to alerts, you should also monitor the various different error statistics in RavenDB. These will indicate whether there could be problems in the underlying data. Faulted databases may speak to disk corruption or low resources. Indexing errors may be causing query issues or might indicate unexpected data in documents.
In SNMP, the following OIDs can be monitored:
- Number of faulted databases:
5.1.10 - Number of indexing errors:
5.2.D.4.I.6 - Number of error indexes in all loaded databases:
5.1.7.3
Networking Usage
To monitor the traffic load on your RavenDB server, you can watch the number of read and write requests as well as the request duration. Depending on your workload your traffic pattern will vary so the intention is to watch for unexpected load to see if there might be an active incident.
In an ideal state, the “cluster term” metric should remain constant. If too many nodes begin to fail, the cluster will elect new leader nodes and the term number will increase. This indicates a potential outage event that may be affecting availability.
In SNMP, the following SNMPs can be monitored:
- Number of open TCP connections:
1.15.1 - Requests per second:
5.2.D.3.5 - Avg request duration in milliseconds:
5.2.D.3.7 - Cluster term:
3.2.1
You can also retrieve RequestsPerSec and PutsPerSec from the statistics endpoints for a server or database.
Hardware Usage
You should monitor RavenDB’s usage compared to the overall system. This will help you monitor whether your system is under- or over-utilized. It’s advisable to set a threshold and alert on low memory or low disk space immediately.
In SNMP, the following OIDs can be monitored:
- Process CPU %:
1.5.1 - Machine CPU %:
1.5.2 - Server allocated memory in MB:
1.6.1 - Server managed memory size in MB:
1.6.7 - Server unmanaged memory size in MB:
1.6.8 - Total swap usage in MB:
1.6.4 - Low memory flag:
1.6.2 - IO Wait in % (Linux Only):
1.5.4 - Remaining disk space in MB:
5.2.D.2.6
You can use the server’s REST API endpoints to retrieve both memory stats and CPU stats.
Indexing Usage
Alongside CPU and memory usage, indexing statistics will help you understand what may be contributing to high usage and how indexes are performing.
In SNMP, the following OIDs can be monitored:
- Documents indexed per second:
5.2.D.3.2 - Maps per second:
5.2.D.4.I.14 - Reduces per second:
5.2.D.4.I.15
You can use the database stats REST endpoint to retrieve some of this information, as well as the database metrics endpoint.
Ongoing Tasks
If you have set up full or incremental periodic backups, these would follow a specific schedule you can monitor for any deviations.
In SNMP, the following OIDs can be monitored:
- Number of backups running:
1.13.1
Recommended System-Wide Counters
Besides internal RavenDB metrics, it is useful to track system-wide metrics which are typically exposed in performance counters. These would be overall stats like CPU usage, memory usage, disk space, etc. as well as low-level operating system performance metrics.
On Windows, you can use the perfmon tool and on Linux you can use many different performance monitoring tools.
Disk Queue Length
Disks operate by queueing write operations. It is normal to experience some disk queuing for short periods of time. A monitor should be watching the duration the disk queue length remains high. If the disk queue length is high, it means reads and writes to RavenDB will be bottlenecked by I/O.
Experiencing high disk queue length for a long duration indicates the need to optimize your storage. RavenDB will report slow writes to disk in the Studio notification center.
In Windows, you can monitor the performance counter Average Disk Queue Length. In Linux, you can use the iostat tool which measures average disk queue length as avgqusz.
Hard Page Faults
I/O operations in RavenDB are “memory-mapped” meaning the database delegates to the operating system to buffer the cache and choose the appropriate memory working set size. When you do not have enough memory for your workload, you will begin seeing page faults. Page faults occur when the OS could not read from a memory location it expected and has to read from another memory location (“soft” or “minor”) or from disk (“hard” or “major”). A small number of faults are to be expected but it’s important to monitor the amount of hard page faults.
In Windows, you can monitor the performance counter Page Reads/sec for hard faults. In Linux, hard page faults can be viewed using the ps, top, sar, or time command.
Conclusion
Monitoring is critical for production deployments to help identify, diagnose, and prevent issues that could lead to service degradation and application downtime. It is important to monitor both system-level and RavenDB-level metrics to get context into problems.
For a deeper dive into specific ways to diagnose and troubleshoot issues with RavenDB, check out the Monitoring, troubleshooting, and disaster recovery chapter in the Inside RavenDB book.
Woah, already finished? 🤯
If you found the article interesting, don’t miss a chance to try our database solution – totally for free!