Time Series
- Time series are sets of numeric data, associated with timestamps and ordered by time.
-
The studio interface allows you to edit, query and index time series data, as well as view it as a list of entries or as a graph.
-
In this page:
Document View
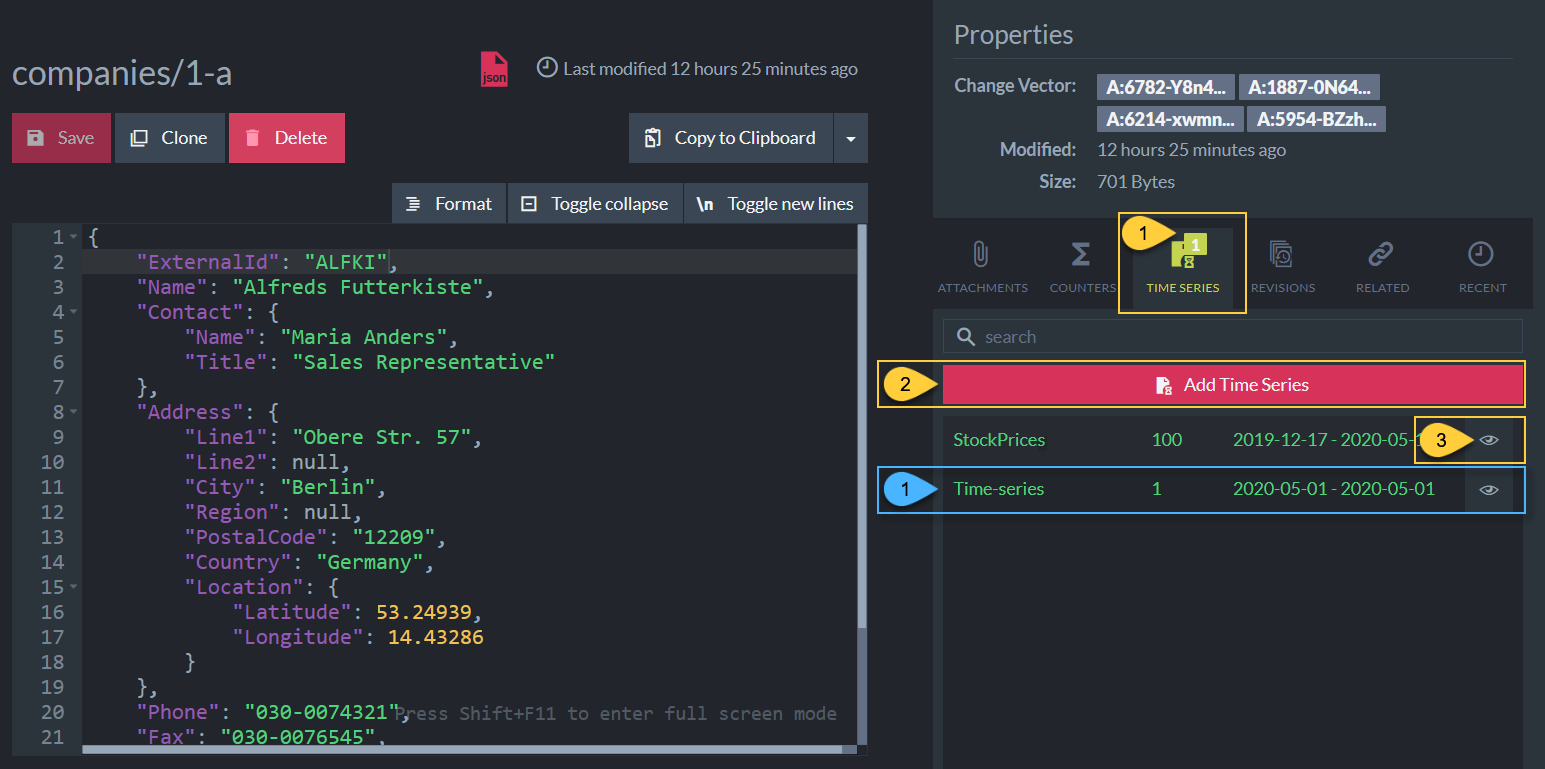
Time Series - Document View
Actions
- To view a document's time series, open its document view and click the time series tab on the right.
- Click to create a new time series, see more below.
- Click to view and modify time series data.
Info
-
Displays the time series':
- Name
- The number of entries it contains
- The range of time from the first to the last entry in the time series
Time Series View
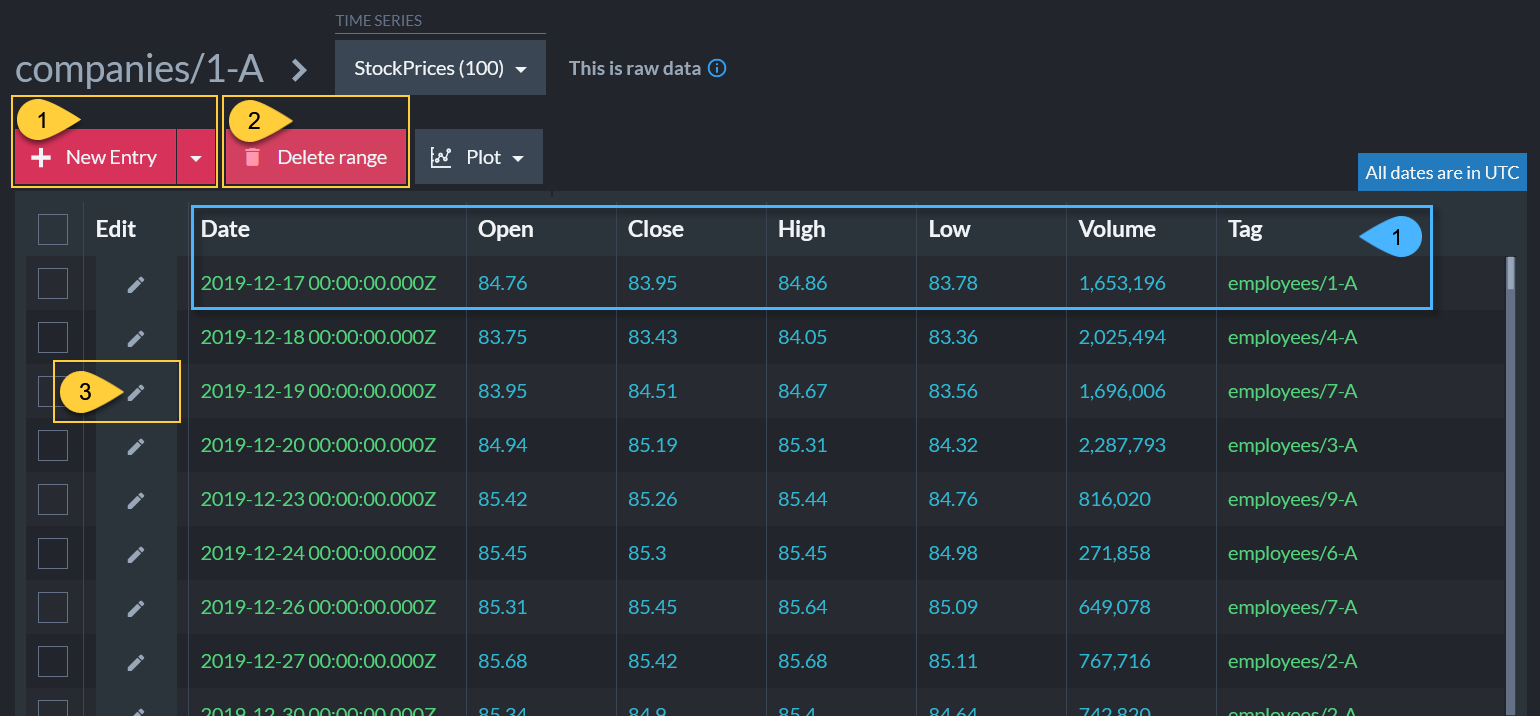
Time Series View
Actions
- Click to add a new entry to this time series (StockPrices), or click the dropdown to create a new time series.
- Delete all entries from a specified time range.
- Edit entry.
Info
-
Displays time series entries' data, including -
- Timestamp
- Numerical data (1-32
doublevalues) - Optional tag
string
Create new Time Series (by Creating the First Entry)
-
A time series is created upon the creation of its first entry (and deleted once all entries have been deleted).
-
Click the Add Time Series button from the Document View to create the time series' first entry.
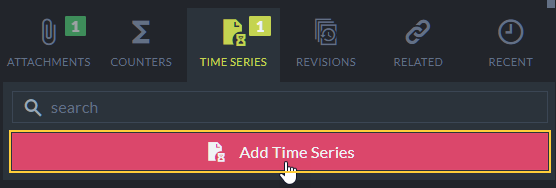
Add Time Series
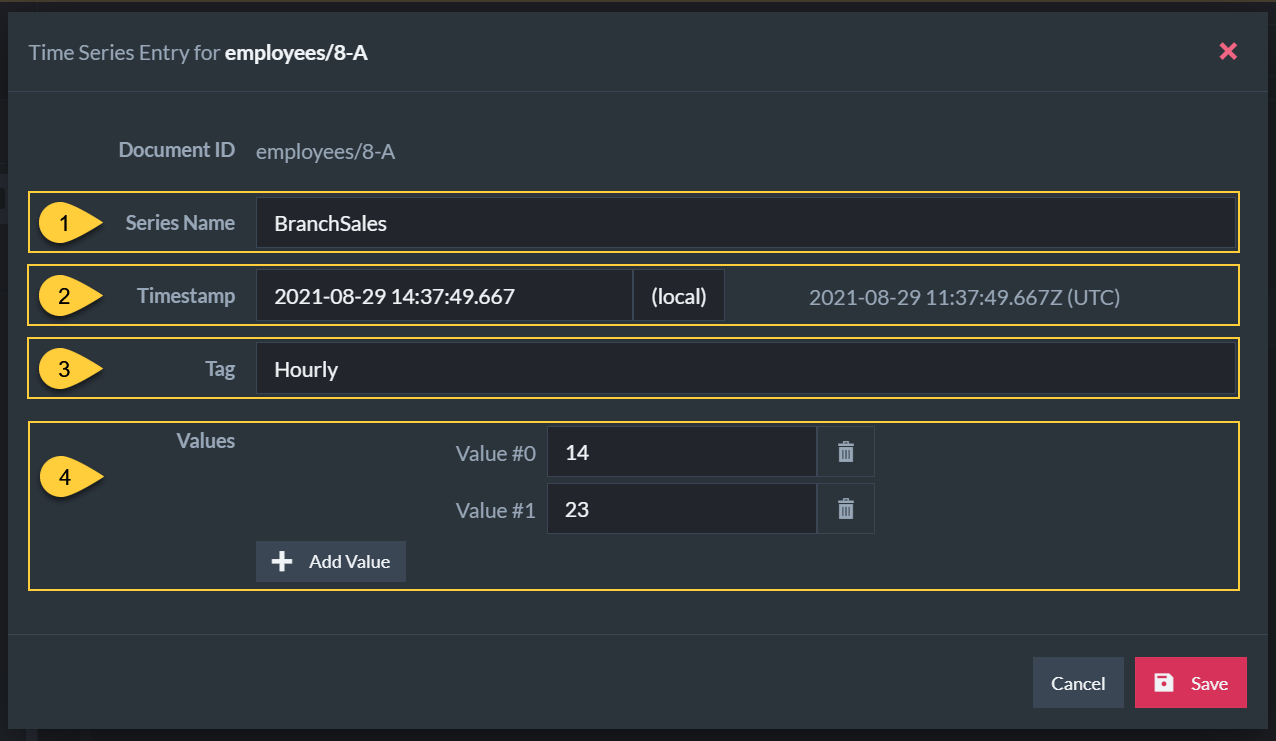
Add Time Series Entry
- Enter time series' name.
- Select a timestamp for the new entry.
- Create an optional tag.
- Add one or more numerical values (up to 32 values).
 Time series entry values can be given meaningful names rather than labels like Value #0 and Value #1.
To set entry values' names, use Studio's Time Series Settings View.
Editing an Entry
- Click the Edit Item button from the Time Series View to edit a time series' entry.

Edit Time Series
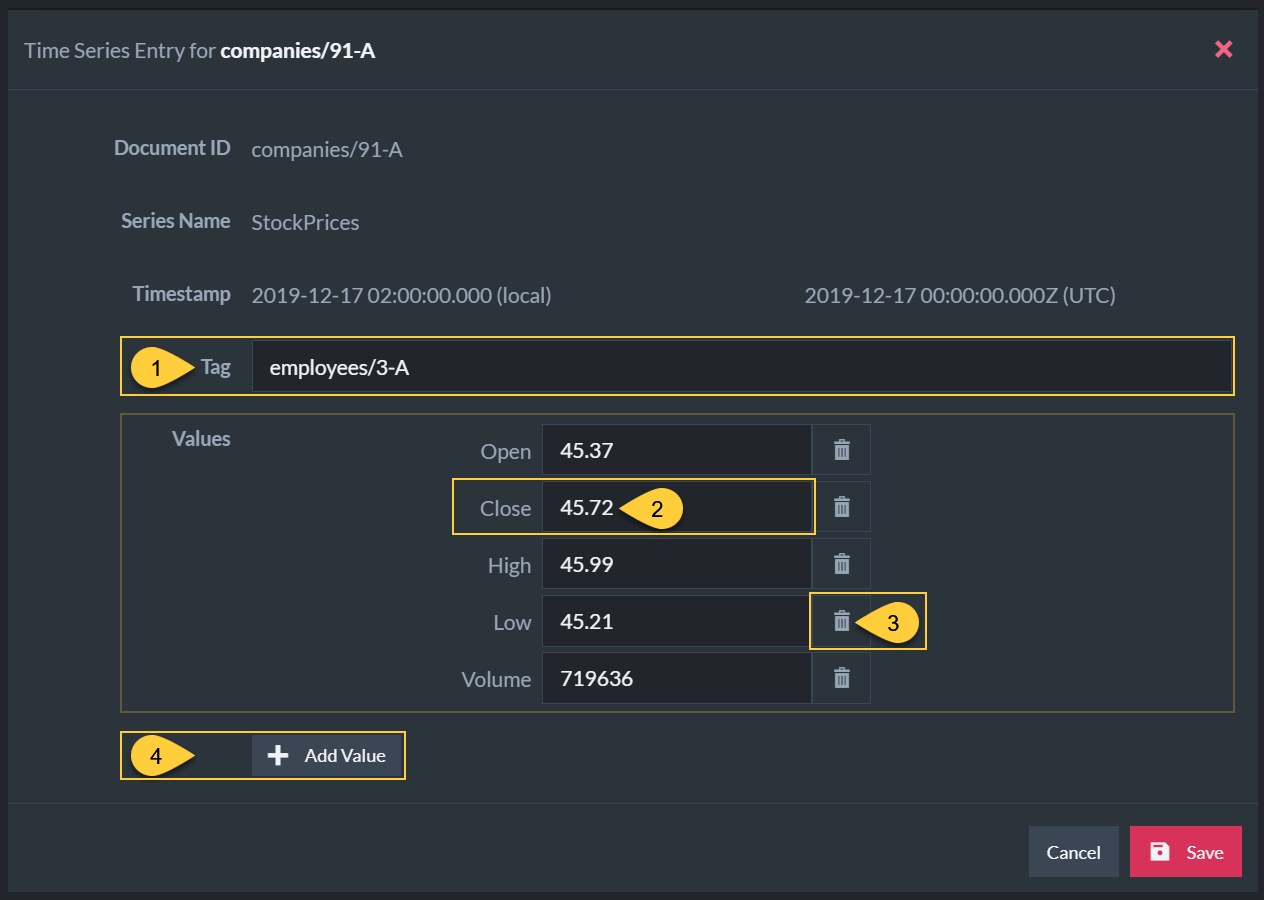
Edit Time Series Entry
- Edit the optional tag.
- Edit a numerical value.
- Delete value.
- Add an additional value (up to 32 values).
Deleting a Range of Entries
- Click the Delete Range button from the Time Series View to delete a range of time series entries.

Delete Range Button
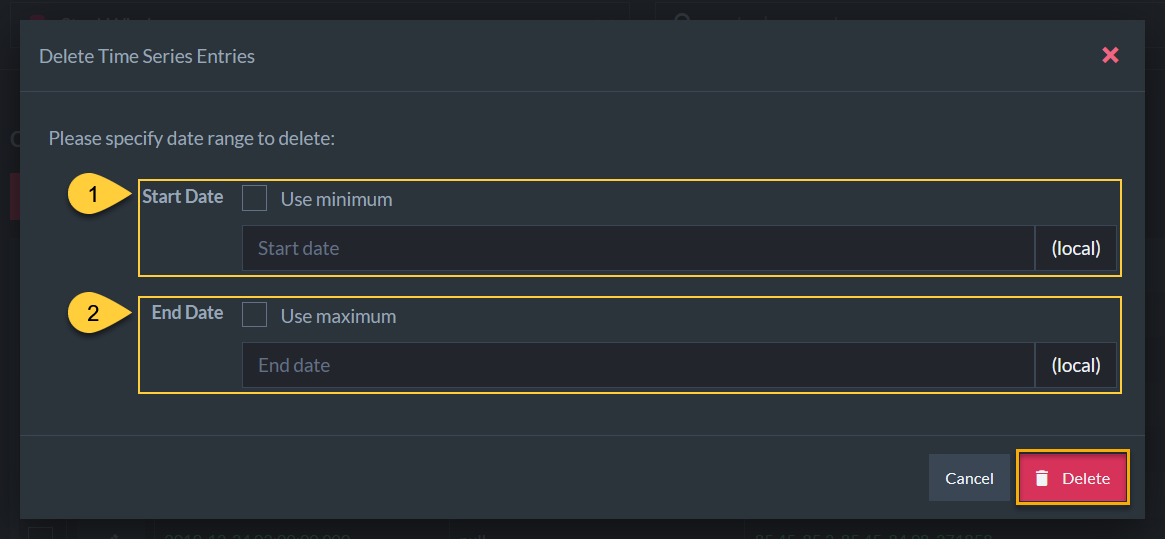
Delete Range
To specify a range of time series entries:
- Start Date
Check Use minimum to use the first entry's timestamp as the start of the range, - End Date
Check Use maximum to use the last entry's timestamp as the end of the range.
- For either option, you can click the input bar and specify some other date in the date & time dialog shown below.
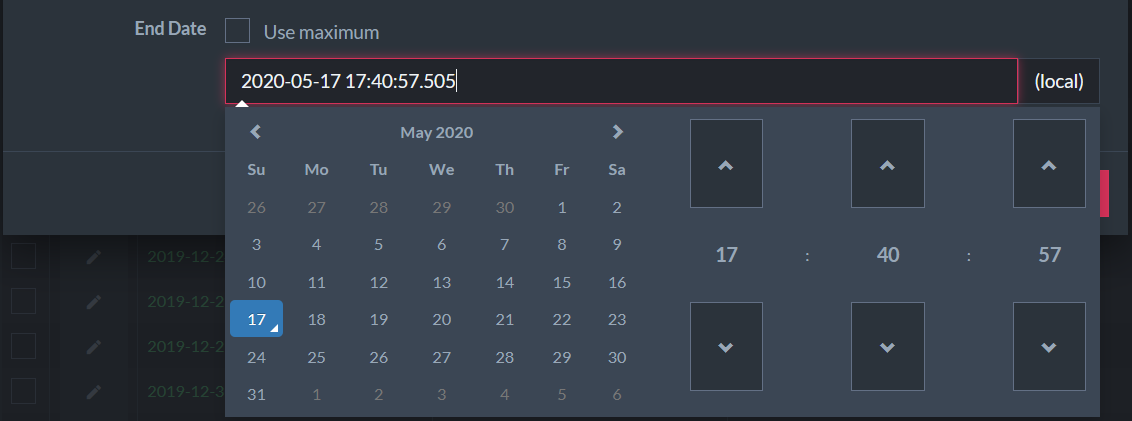
Delete Range - Pick Date and Time
Querying Time Series
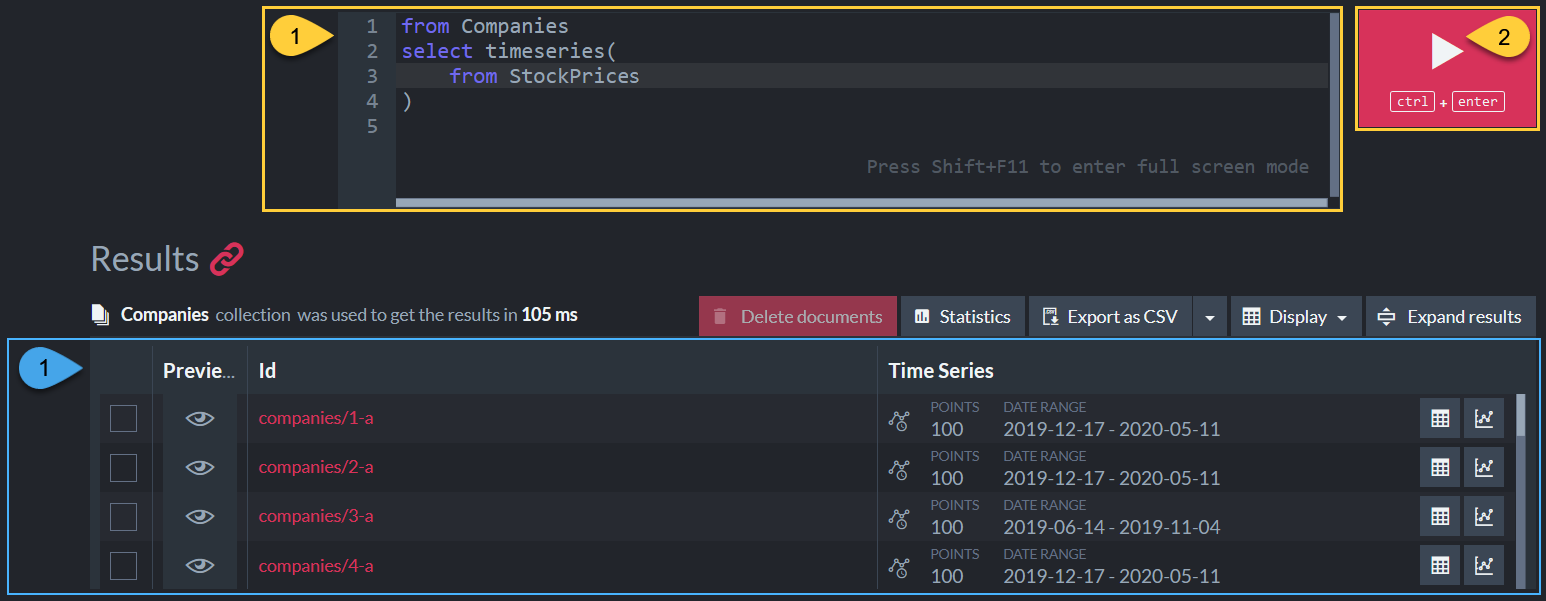
Time Series Query
Actions
-
Enter your RQL query in the query box.
Depicted here is a query to get all the StockPrices time series values from documents in the Companies collection.
Learn more about time series queries here. -
Click to run the query.
Info
-
Query Results - A list of time series that satisfy the query, with:
- The ID of the associated document.
- Number of entries and time range.

Time Series Query - Actions
- Click to open a tab with the time series query results shown in a table.

- Click to open a tab with the time series query results shown in a graph (see below).
-
Multiple documents selection
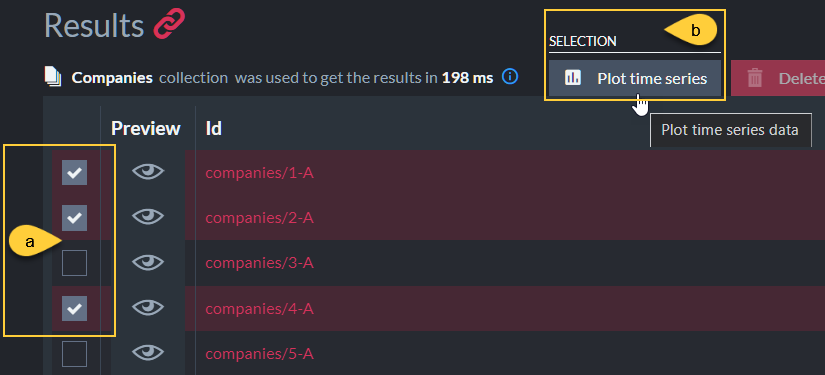
- a. Select multiple documents to plot their time series.
- b. Click to view the selected documents' time series results in a unified graph.
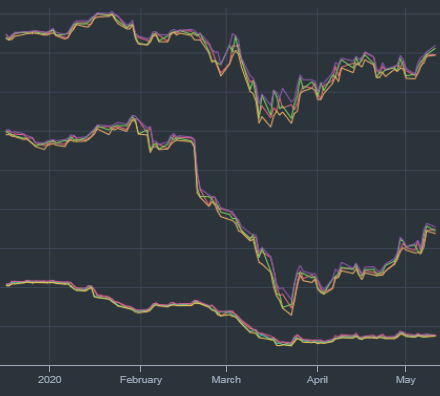
Results in Graph View
Time series results in a graph
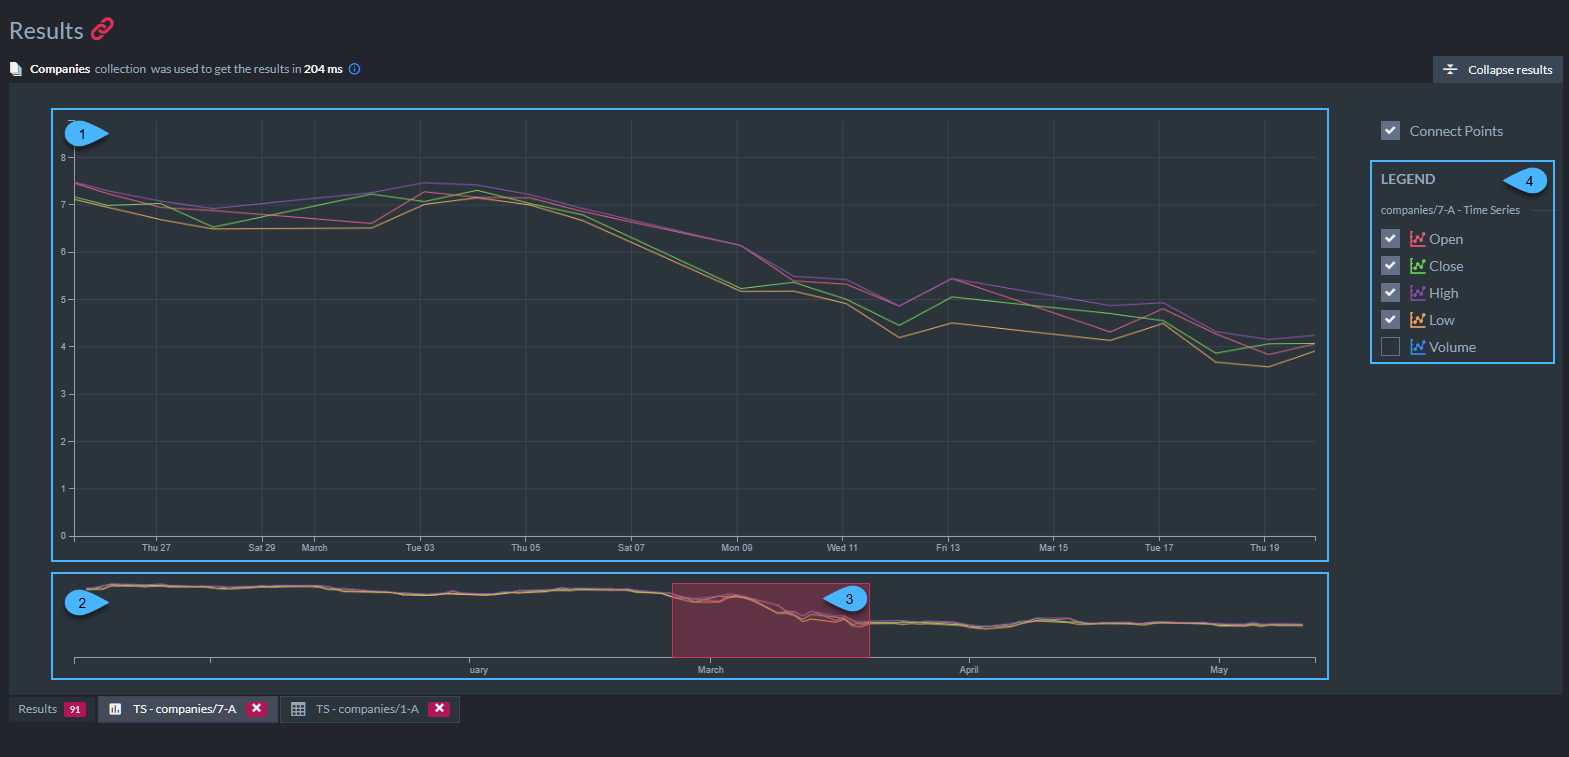
- A graph of time series results in a selected time frame.
- A graph showing all the time series results over time.
- The selected time frame.
- A legend of time series entries' values.
The entry values names are set in Studio's Settings > Time Series view.
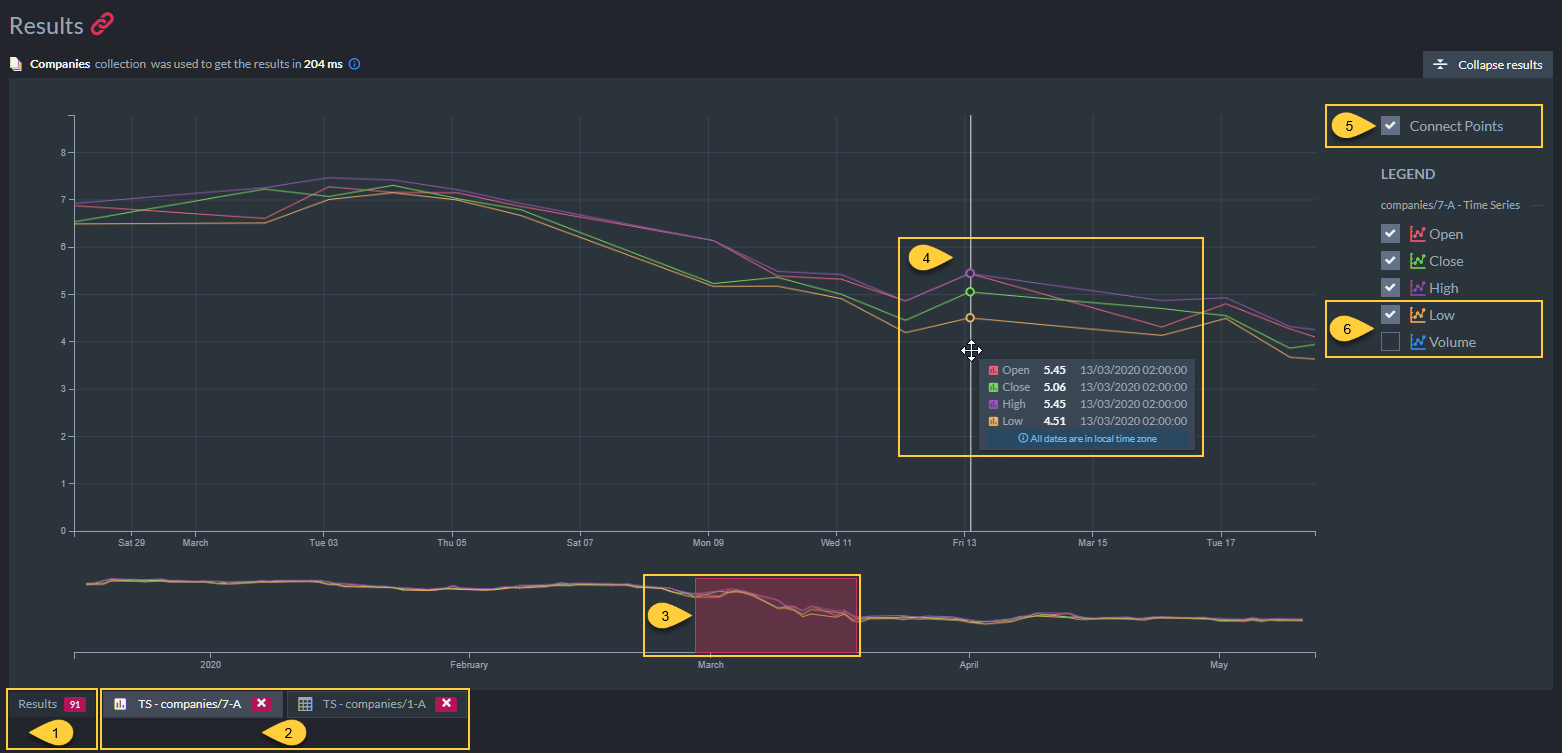
Time series results in a graph - Actions
- Click to go back to the query results tab.
- Display tabs with graph or table results.
- Drag or resize the selected time frame to view the corresponding results.
- Hover your mouse over the graph to view the data of one particular entry.
- Toggle viewing points or a continuous line.
- Check/Uncheck to plot or hide time series entries' values on the graph.