Graph Querying: Overview
The graph queries feature is available in RavenDB versions 4.2 to 5.x.
The feature is not available in higher (6.0 and on) versions.
RavenDB's experimental graph support allows you to query your database as if it has been pre-arranged in graph format, gaining extreme efficiency and speed in recognizing relations between data elements and organizing them into searchable patterns. Intricate relationships that would render standard queries useless, become the asset they are meant to be.
-
No need for preliminary preparations.
You do not need to alter your database's structure or contents in order to start using graph queries. Existing collections and documents are used as graph elements, and their relations are inferred from existing document properties. -
Simple and effective syntax.
We've integrated graph support into RQL to make its learning and usage accessible and intuitive for any user, especially those already familiar with our query language. -
Comprehensive support.
Queries can be constructed either by clients using API methods or manually using the Studio, and are executed by your distributed database. Results can be retrieved by your clients, or shown textually and graphically using the Studio.
Sample queries included in this article use only data that is available in the
Northwind sample database,
so you may easily try them out.
Introduction To Graph Modeling
- In The Beginning..
One of the best known founding moments of graph theory is Leonhard Euler's attempt at solving the Königsberg Bridges riddle, eventually tackling the problem by representing the scenery and its elements in a graph.
Euler's search for an optimal path is a great referral to the practicality of graph theory, leading all the way to its present-day effectiveness in managing complex data volumes. - Graph modeling and complex data volumes
As non-graphical data models are inefficient in (and often incapable of) searching and managing large and complex data sets with intricate relations, various applications take part in complementing or replacing them.
Databases capable of running graph queries are a major contribution in this regard. - Graph modeling in a multi-model database
People often fulfill their graph modeling needs using dedicated graph databases. While this does offer a solid solution, it also produces additional issues that need to be resolved - like the need to integrate source data and graph results.
Using the graph capabilities of a multimodel database is a native solution that you can use directly without creating additional issues.
RavenDB is a multimodel database whose graph capabilities are founded upon superb document store and indexing engine. Data already deposited in database documents and indexes can participate in graph querying with no preceding arrangements, easing user administration and improving internal logic and data management.
Enabling Graph Querying
Graph support is an experimental feature and is disabled by default.
To activate it you need to edit RavenDB's configuration file
and enable experimental features.
Creating Graph Queries
Graph querying is an expansion of RavenDB's RQL; you can build and test graph queries using the Studio, exactly as you would with non-graph RQL.
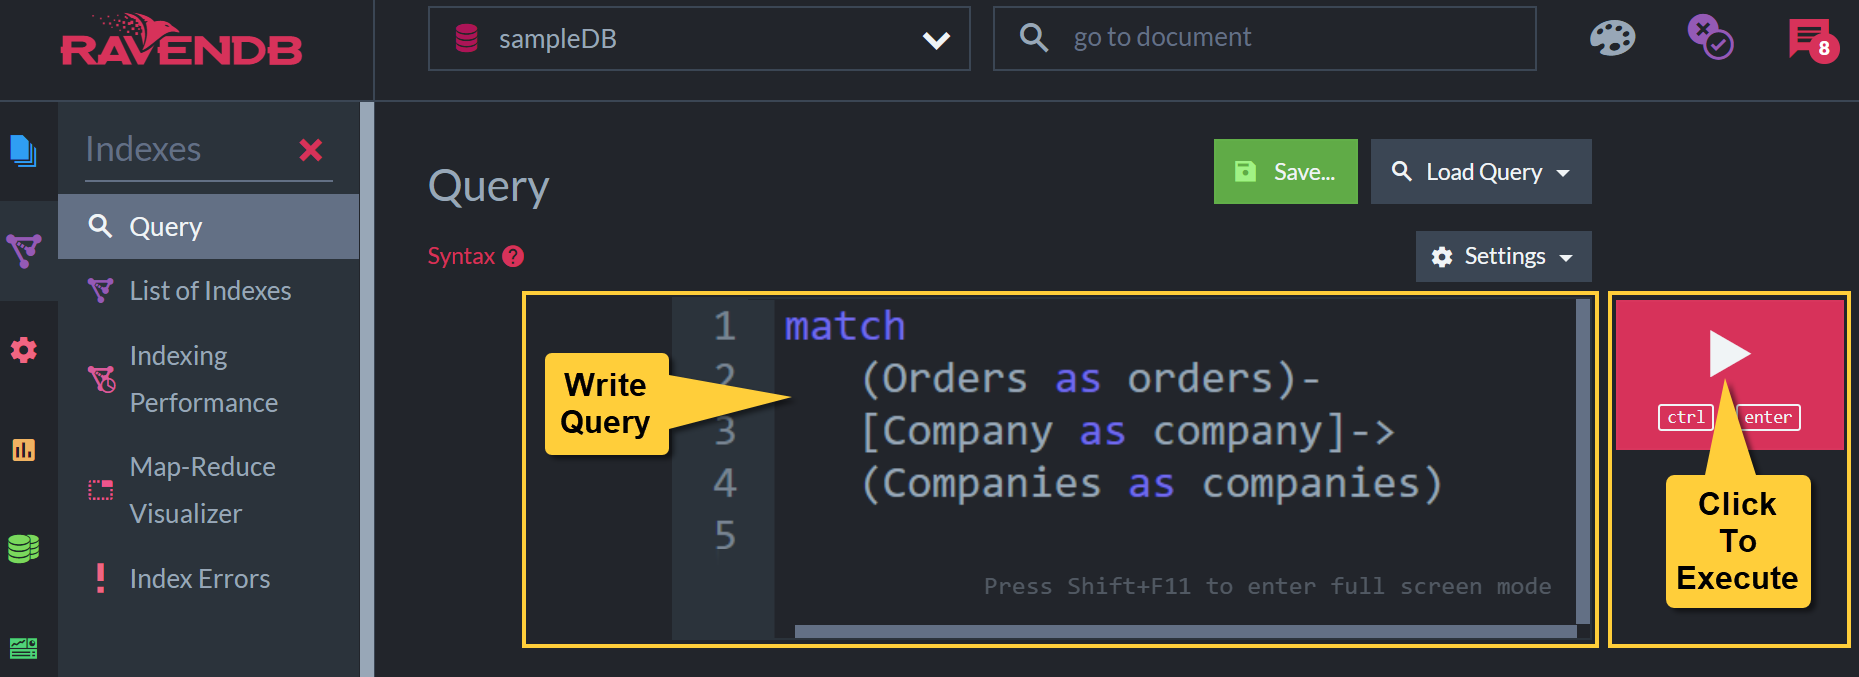
Graph Query
The Studio will identify graph queries by their syntax, execute them as such and automatically show their results both graphically and textually.
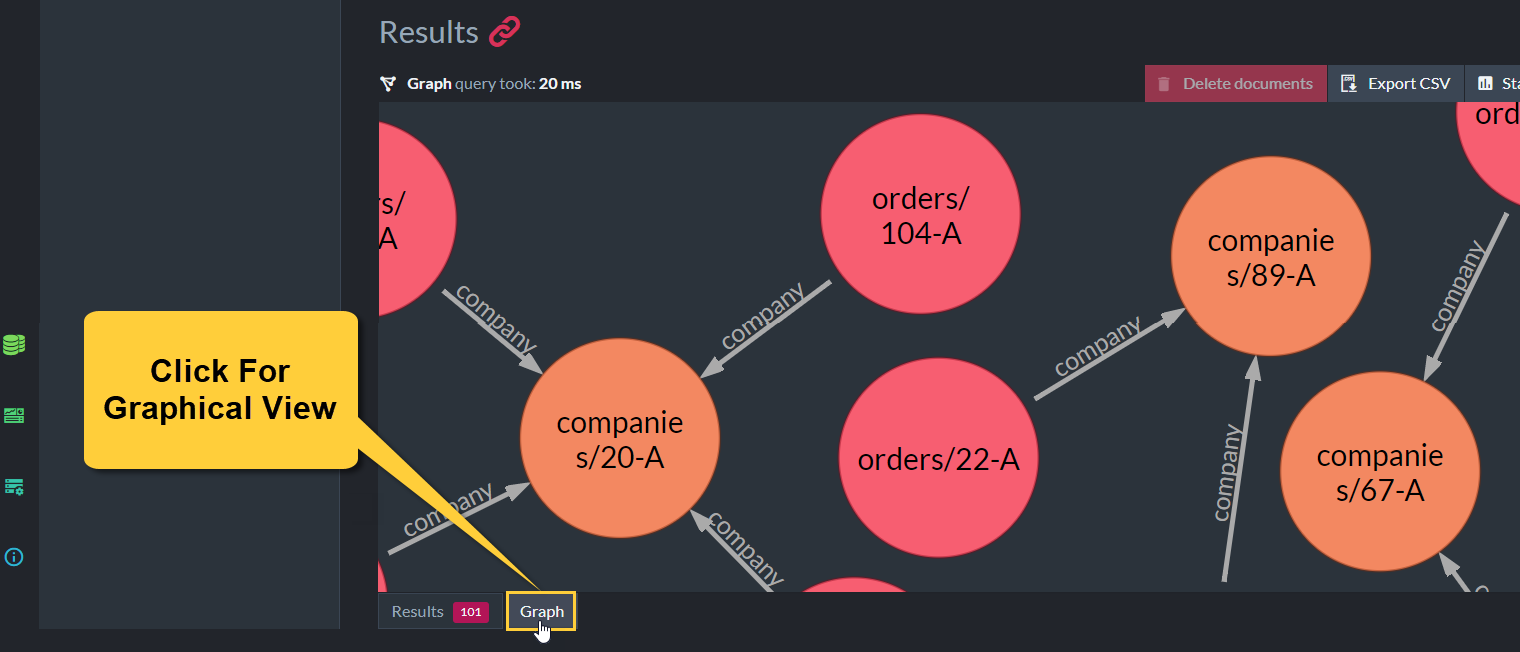
Graphical View
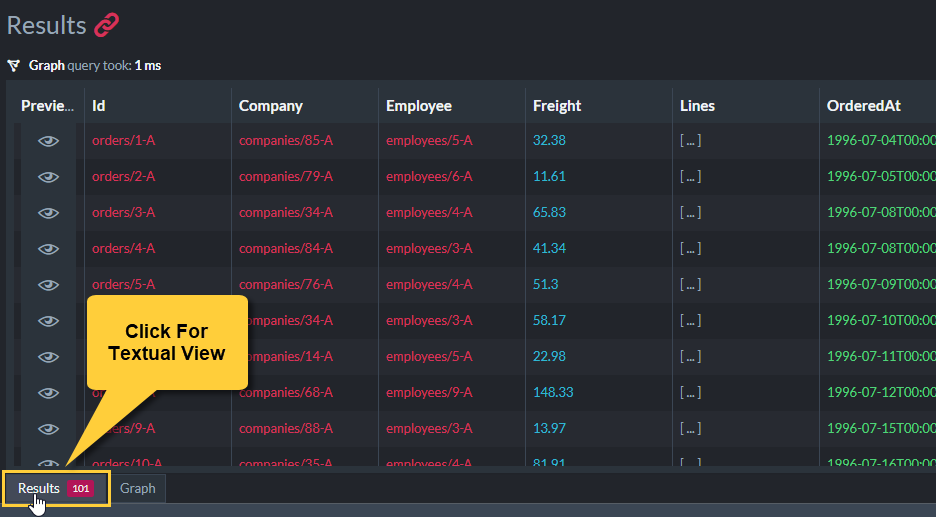
Textual View
The Structure of a Basic Query
The vocabulary and syntax of graph queries are simple and straightforward. Take for example
the following basic query, that maps an organization's "chain of command" by finding who each
employee reports to.
match
    (Employees as employed) -
    [ReportsTo as reportsTo]->
    (Employees as incharge)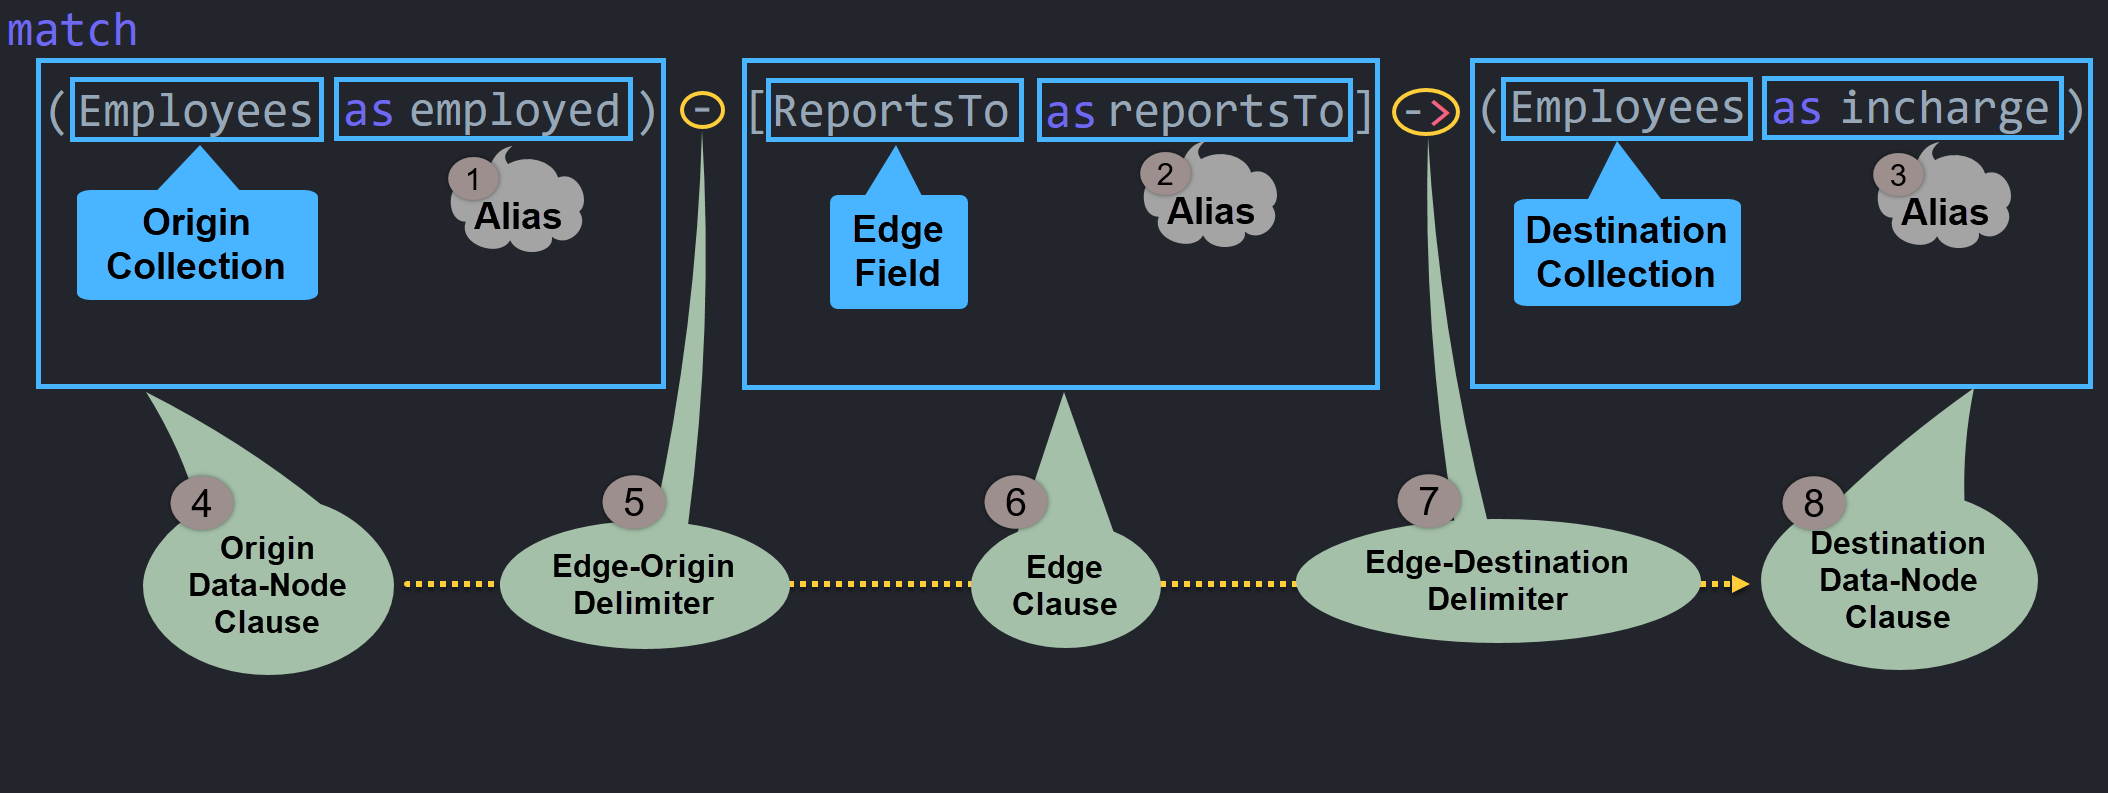
Graph query: Query Structure
-
Alias:
employed
Aliases are given to nodes and edges for two main reasons: making queries easier to read and manage, and allowing the filtering and projection of results.In this sample query, understanding the search pattern would have been difficult without aliases because origin and destination data nodes are retrieved from the same collection, Employees. The
employedandinchargealiases distinguish between this collection's different roles in the origin and destination clauses. -
Alias:
reportsTo -
Alias:
incharge -
Origin Data-Node Clause:
(Employees as employed)
This clause indicates where the origin data nodes are looked for.In this sample query, this clause simply retrieves all documents of the Employees collection.
-
Edge Origin Delimiter:
-
The hyphen connects the edge clause with the origin data-nodes clause.In this sample query the "-" indicates that edges will be fetched from data nodes of the Employees collection.
-
Edge Clause:
[ReportsTo as reportsTo]
The edge clause indicates which data nodes' properties are used as edges.In this sample query edges are a field named ReportsTo in each data node retrieved from the origin collection.
-
Edge Destination Delimiter:
->
Edges contain the IDs of destination nodes.
The arrow indicates in which data set we should be looking for the documents whose IDs the edges hold.In this sample query the arrow indicates that destination nodes' IDs are stored in a field named ReportsTo and the documents are in the Employees collection.
-
Destination Data-Node Clause:
(Employees as incharge)In this sample query edges hold the IDs of documents of the Employees collection.
Results Structure
The graphical view lets you quickly evaluate query results, however complex they may be.
Clicking data nodes in the graphical view displays their contents.
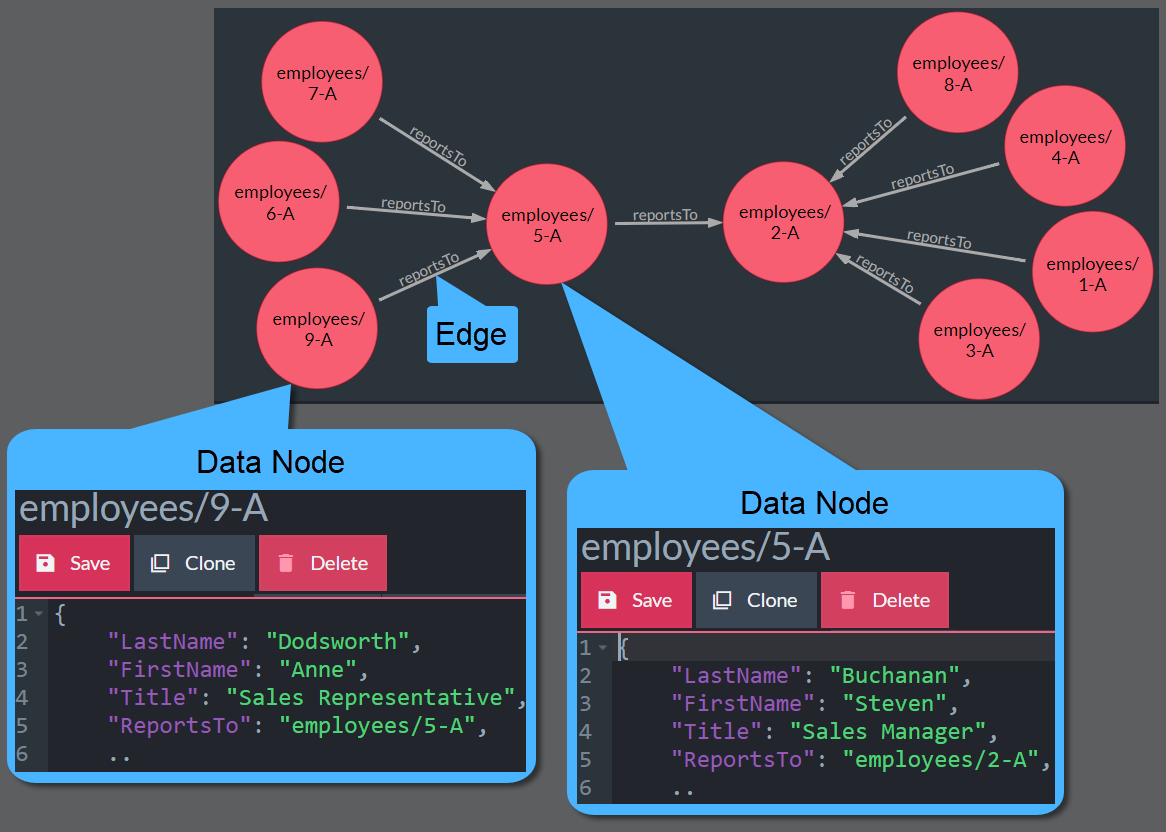
Graph Results: Graphical View
When your query retrieves a whole document, the textual view presents it as {...}.
You can hover above such results to reveal the document's contents.
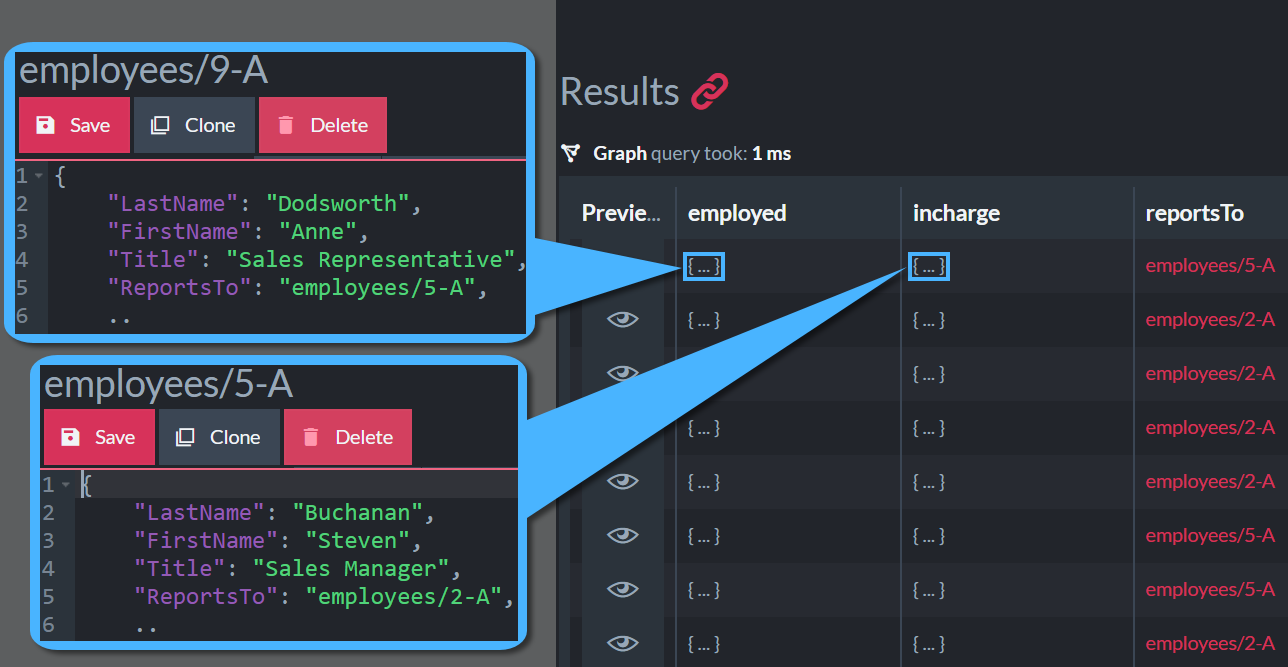
Graph results: Textual View
You can use projection
to retrieve and display precisely the details you're interested in.
Projecting Graph Results
To project selected
query details, follow your query with a select clause. Select elements and properties
you're interested in by their aliases.
Here, for example, is the same basic query we
demonstrated above,
with a projection this time to make its textual view much more helpful.
match
    (Employees as employed) -
    [ReportsTo as reportsTo]->
    (Employees as incharge)

select
   id(employed) as employedID,
   employed.FirstName as employedFirstName,
   employed.LastName as employedLastName,
   employed.Title as employedTitle,
   id(incharge) as inchargeID,
   incharge.Title as inchargeTitle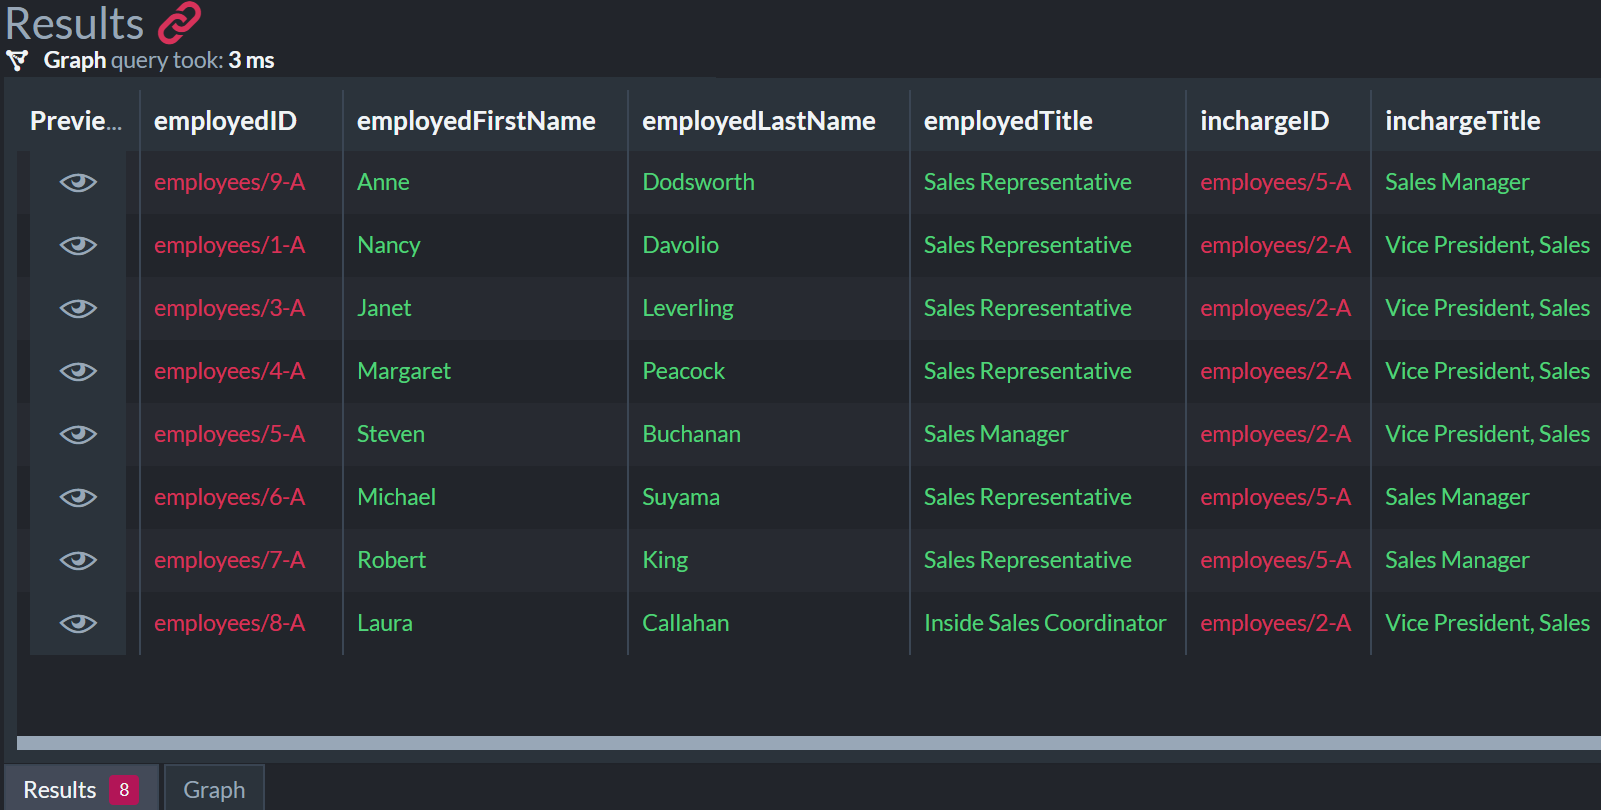
Graph Results: Creating Meaningful Textual View Using Projection