Server Dashboard
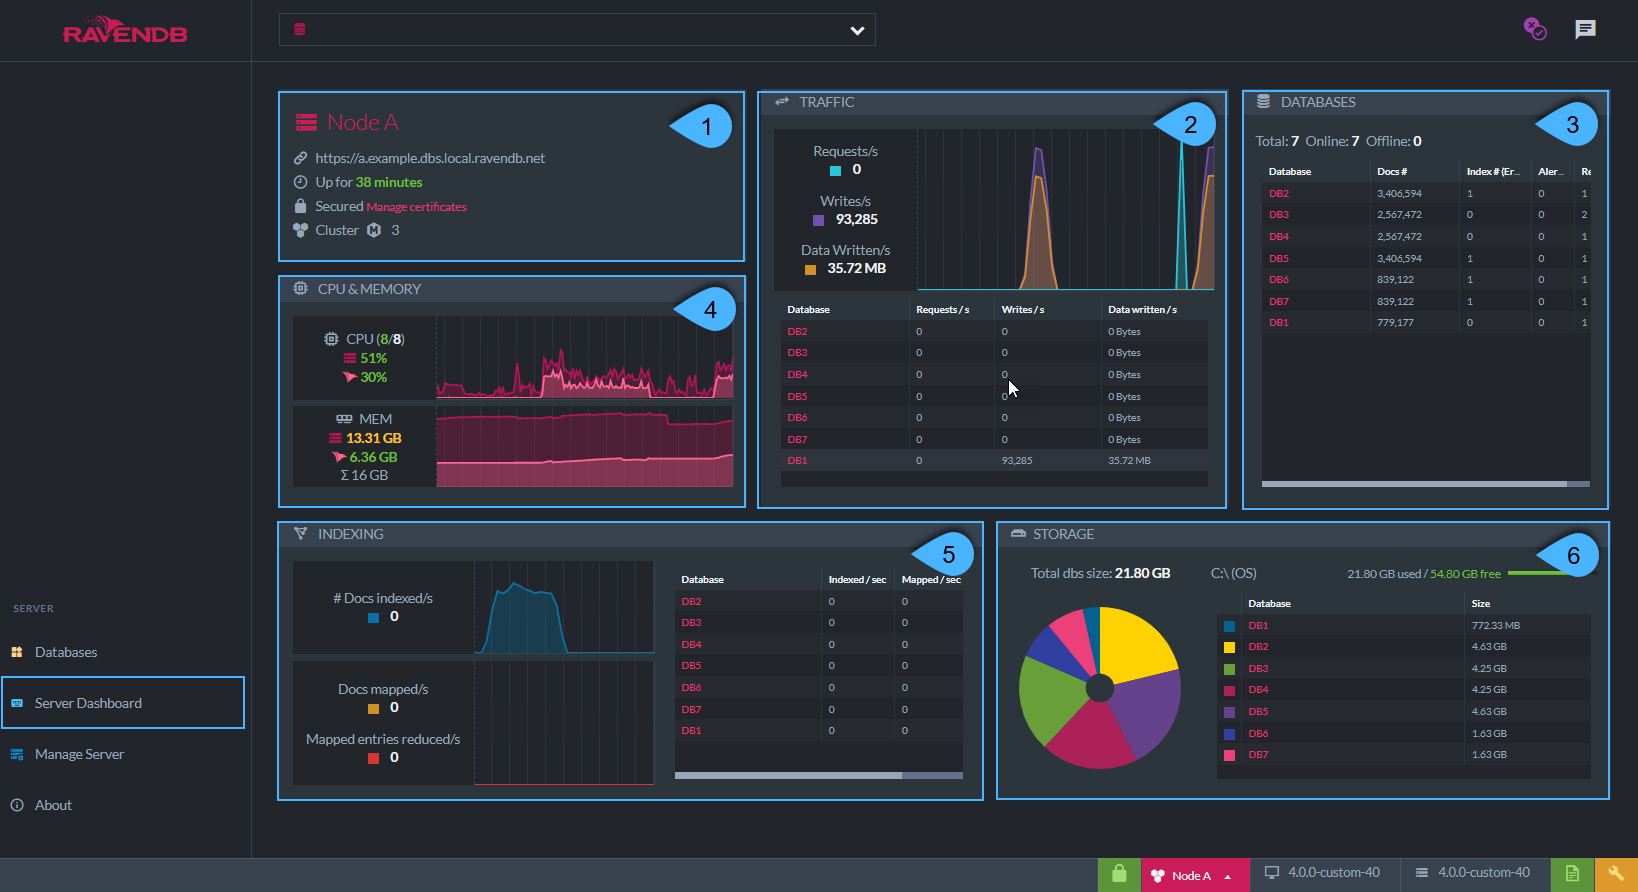
This dashboard provides a diagnostic overview of the RavenDB server performance and databases state.
The Server Dashboard

Server Dashboard
-
Server Node Details:
Data about the running server such as:- The server IP address
- Time it is up and running
- Secured info
- Number of members in cluster
-
Traffic:
- Requests - Number of requests handled by the server
- Writes/s - Documents count written per sec by the server
- Data written/s - Number of bytes written by the server to disk
-
Databases:
Databases summary - number of documents, indexes, alerts & replica factor -
CPU & Memory:
CPU & memory usage by the machine and by RavenDB -
Indexing:
- Number of documents indexed per second with detailed info about mapped and reduced actions
- Showing total documents and per database
-
Storage:
Databases size on disk
Help Us Improve Prompt
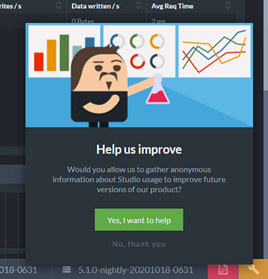
When you first launch RavenDB, you will see this prompt asking if you'd be willing to anonymously share some Studio usage data with us in order to help us improve RavenDB:

Help Us Improve
Once you respond to this prompt, it should not appear again. However, in some scenarios, such as running RavenDB embedded, or working without browser cookies, the prompt may appear again.
If necessary, you can add this flag to the Studio URL to prevent the prompt from appearing:
<Studio URL>#dashboard?disableAnalytics=true