Cluster Dashboard: Widgets
- Widgets in the cluster dashboard display live diagnostic information about the whole cluster.
-
Information is displayed for all cluster nodes.
-
Available Widgets:
Let's Get Started Widget
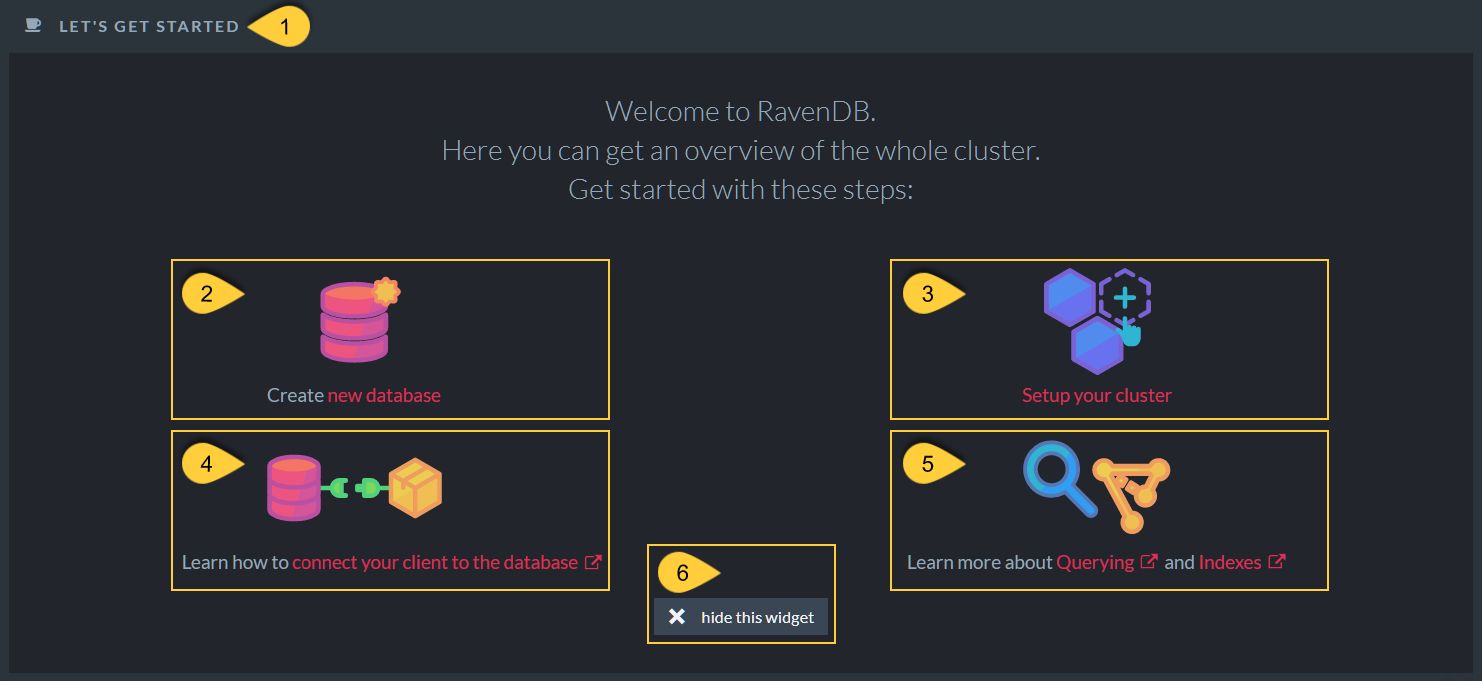
Let's Get Started Widget
- The Let's Get Started widget offers a comfortable starting point with links to setting up your cluster, creating a new database, and learning basic RavenDB concepts.
- Create New Database
Click to create a new database. - Setup Your Cluster
Click to open Studio's Cluster View so you can create and manage your cluster. - Learn how to connect your client to the database
Click to learn how to connect your client to your database using RavenDB's API. - Learn more about Querying and Indexes
Click to learn how Querying and Indexes are managed in RavenDB. - Hide This Widget
Click to remove the Let's Get Started widget from the cluster dashboard view.
The operation is reversible, any widget that was removed can be added later to the cluster dashboard.
CPU Widget
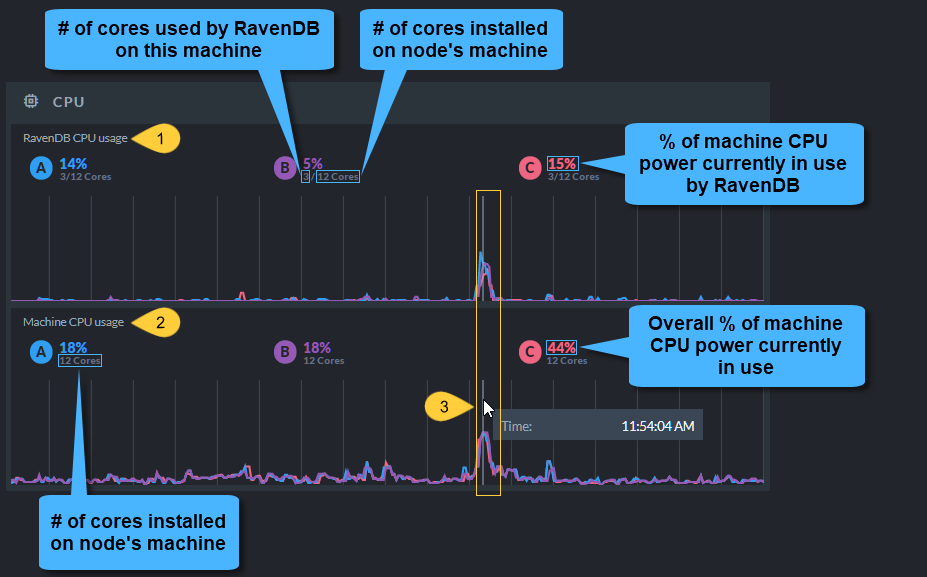
CPU Widget
- RavenDb CPU Usage
RavenDB usage of CPU & Cores per node. - Machine CPU Usage
Machine usage of CPU & Cores per node. - Data Displayed
The CPU widget shows the current CPU usage.
Hover over the timeline to display earlier data.
Memory Widget
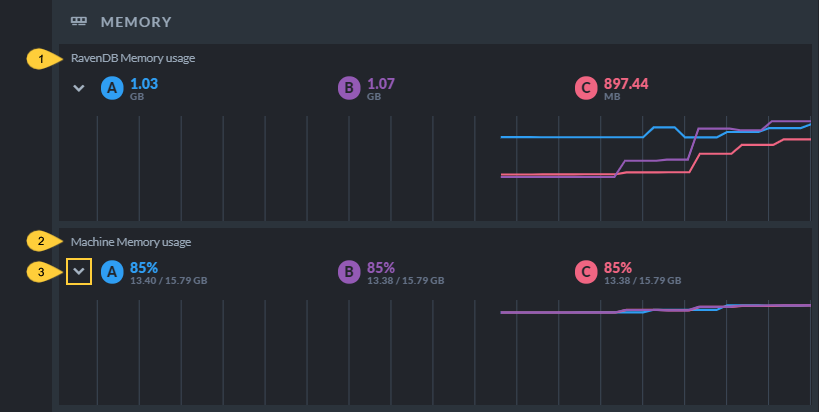
Memory Widget
- RavenDB Memory Usage
Memory used by RavneDB. - Machine Memory Usage
Memory used by the nodes' machines. - Click to toggle on/off additional statistics.
Memory Widget - Additional Statistics View
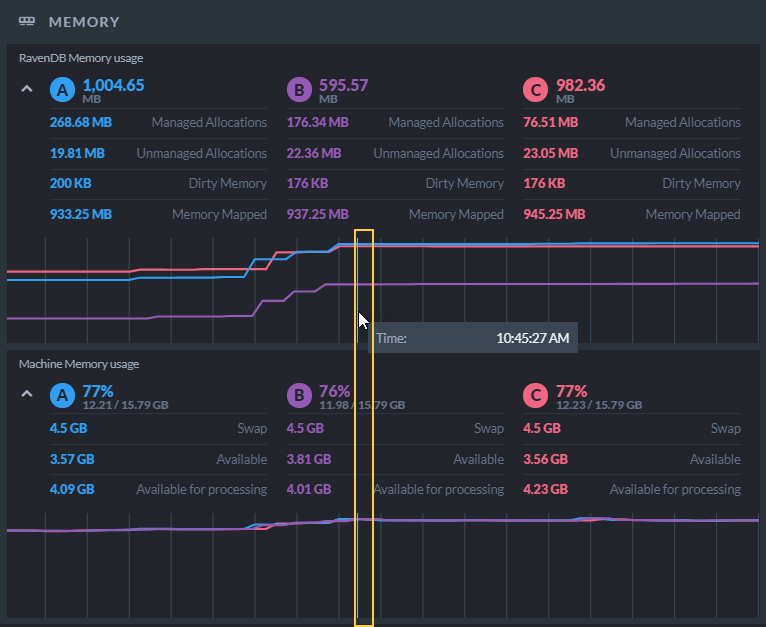
Memory Widgwt - Additional Statistics View
- Data Displayed
The memory widget shows the current memory usage.
Hover over the timeline to display earlier data.
Traffic Widget
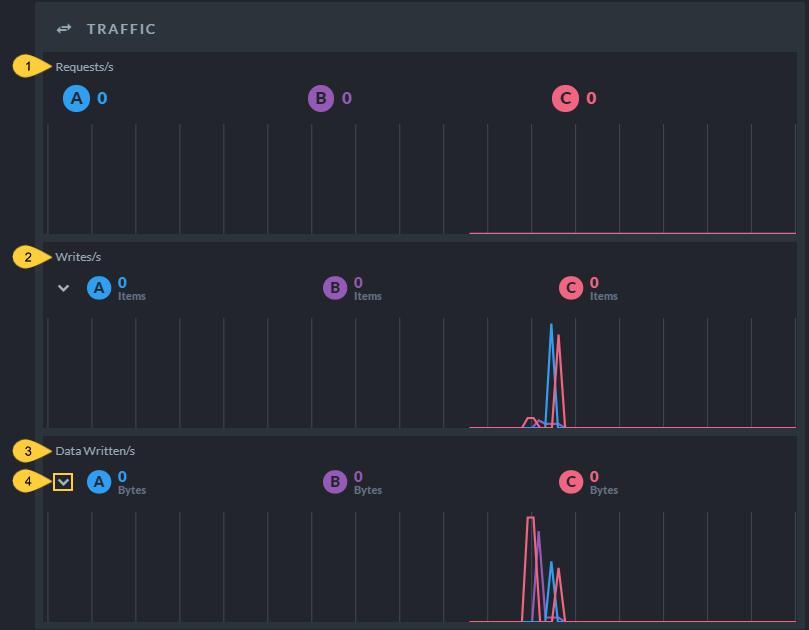
Traffic Widget
- Requests/s
Number of HTTP requests made to the node per second. - Writes/s
Number of items (documents, attachments, etc.) written by the node per second. - Data Written/s
Amount of data written by the node per second. - Click to toggle on/off additional statistics.
Traffic Widget - Additional Statistics View
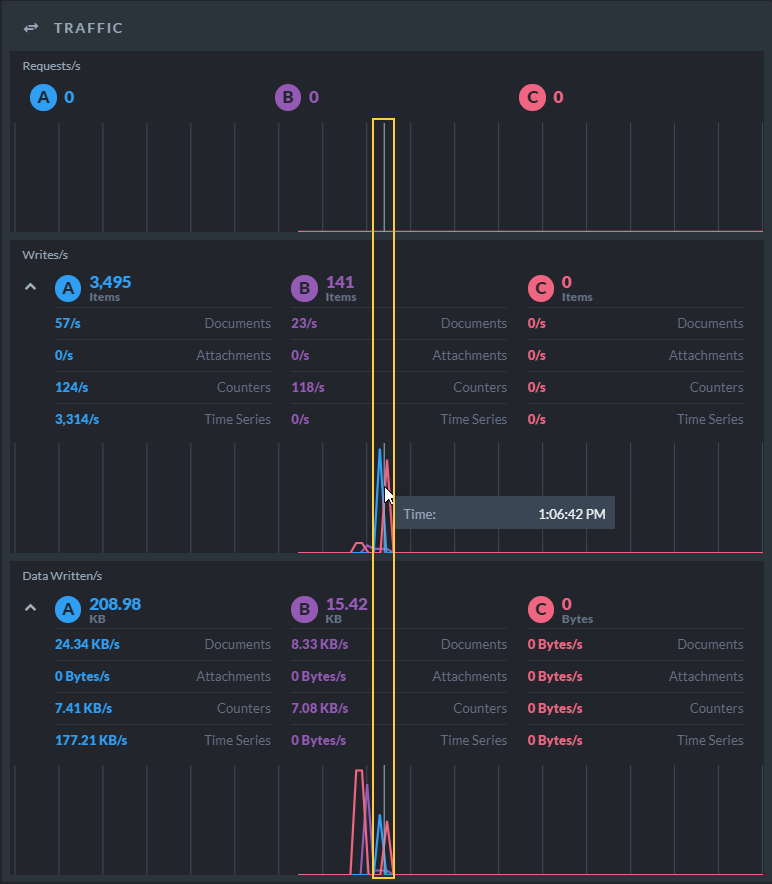
Traffic Widget - Additional Statistics View
- Data displayed
The traffic widget shows the current traffic usage.
Hover over the timeline to display earlier data.
Traffic Per Database Widget
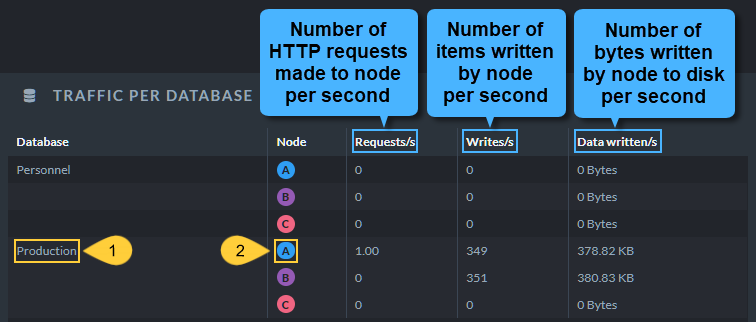
Traffic Per Database Widget
- Database Name
The Database column lists all your databases. - Node Tag
Click a node tag to open the node's Traffic Watch view where all HTTP requests made to the node can be viewed.
Indexing Widget
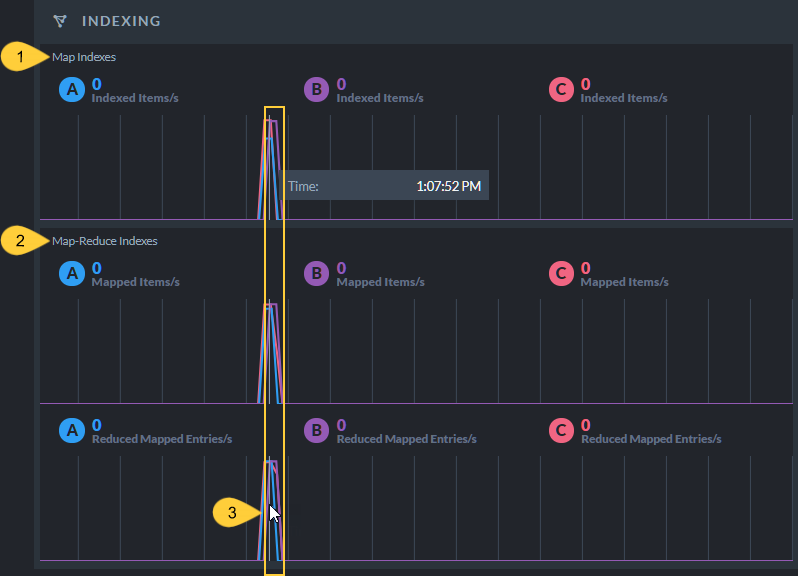
Indexing Widget
- Map Indexes
Indexed items (documents, attachments, counters, and time series) per second. - Map-Reduce Indexes
Mapped Items and Reduced Mapped Entries per second. - Data displayed
The indexing widget shows the current indexing volume.
Hover over the timeline to display earlier data.
Indexing Per Database Widget
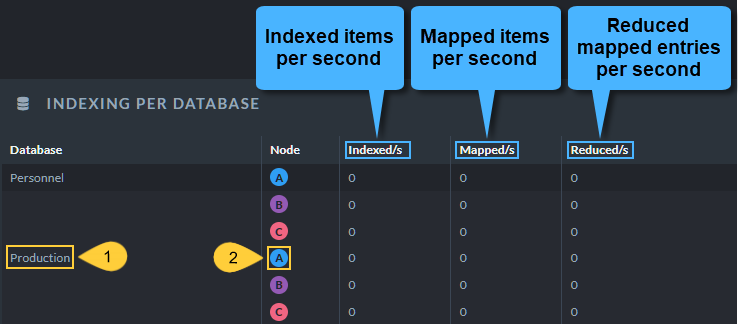
Indexing Per Database Widget
- Database Name
The Database column lists all your databases. - Node Tag
Click a node tag to open the Indexing Performance view for the selected node.
Storage Widget

Storage Widget
- Storage used by RavenDB.
- Storage used by the node's machine.
- Free storage remaining on the node's machine.
- Overall disk capacity on the node's machine.
Storage Per Database Widget
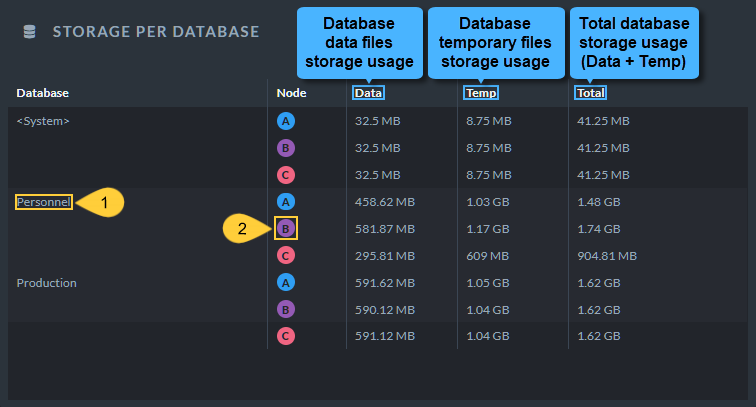
Storage Per Database Widget
- Database Name
The Database column lists all your databases. - Node Tag
Click a node tag to open the Storage Report view for the selected node.
License Widget
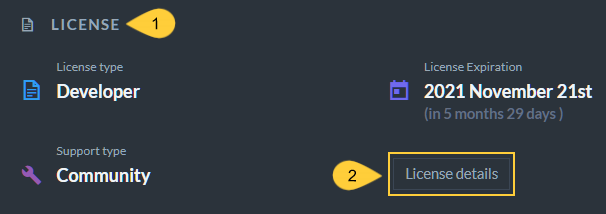
License Widget
- The License widget displays your license Type, Expiration date and remaining period, and Support Type.
- License Details
Click to open the About view which contains information about your License and Support plan.