 Skip to Navigation
Administration: Statistics
Server statistics
Server statistics are available in the Studio via the Server Dashboard, and can
also be retrieved by dedicated endpoints.
Metrics
To get server metrics use the {serverUrl}/admin/metrics endpoint
A document containing the following metrics is retrieved:
-
Requests
- RequestsPerSec
- ConcurrentRequestsCount
-
Docs
- BytesPutsPerSec
- PutsPerSec
-
Attachments
- BytesPutsPerSec
- PutsPerSec
-
MapIndexes
- IndexedPerSec
-
MapReduceIndexes
- MappedPerSec
- ReducedPerSec
where each meter has the following format:
{
    Current: 3,
    Count: 217937,
    MeanRate: 0.2,
    OneMinuteRate: 1.2,
    FiveMinuteRate: 0.2,
    FifteenMinuteRate: 0.1
}
Memory Stats
In order to get server memory statistics, use the {serverUrl}/admin/debug/memory/stats endpoint
A document containing the following memory statistics is retrieved:
{
    WorkingSet: 600551424,
    TotalUnmanagedAllocations: 30422368,
    ManagedAllocations: 217681656,
    TotalMemoryMapped: 842530816,
    PhysicalMem: "4 GBytes",
    FreeMem: "2.38 GBytes",
    HighMemLastOneMinute: "2.38 GBytes",
    LowMemLastOneMinute: "2.38 GBytes",
    HighMemLastFiveMinute: "2.38 GBytes",
    LowMemLastFiveMinute: "2.35 GBytes",
    HighMemSinceStartup: "2.87 GBytes",
    LowMemSinceStartup: "1.06 GBytes",
    Humane: {
        WorkingSet: "572.73 MBytes",
        TotalUnmanagedAllocations: "29.01 MBytes",
        ManagedAllocations: "207.6 MBytes",
        TotalMemoryMapped: "803.5 MBytes"
    },
    Threads: [
        {
            Name: null,
            Allocations: 62016514,
            HumaneAllocations: "59.14 MBytes",
            Ids: [
                {
                    Id: 11682,
                    Allocations: 29146296,
                    HumaneAllocations: "27.8 MBytes",
                },
                {
                    Id: 11897,
                    Allocations: 18383430,
                    HumaneAllocations: "17.53 MBytes",
                },
                {
                    Id: 11801,
                    Allocations: 8290370,
                    HumaneAllocations: "7.91 MBytes",
                },
                {
                    Id: 11748,
                    Allocations: 2183082,
                    HumaneAllocations: "2.08 MBytes",
                }
            ],
        },
        {
            Name: "RavenDB Tasks Executer",
            Allocations: 1134462,
            HumaneAllocations: "1.08 MBytes",
            Id: 19,
        },
        {
            Name: "Indexing of Orders/ByCompany of test",
            Allocations: 0,
            HumaneAllocations: "0 Bytes",
            Id: 11896,
        },

        ...
    ],
    Mappings : [
        {
	        Directory: "\Databases\Demo",
	        TotalDirectorySize: 134217728,
	        HumaneTotalDirectorySize: "128 MBytes",
	        Details: {
		        Raven.voron: {
			        FileSize: 134217728,
			        HumaneFileSize: "128 MBytes",
			        TotalMapped: 134217728,
			        HumaneTotalMapped: "128 MBytes",
			        Mappings: [
				        {
					        Size: 134217728,
					        Count: 1,
				        }
			        ],
		        }
	        },
        },
        {
	        Directory: "\Databases\Demo\Indexes\Product_Search",
	        TotalDirectorySize: 33554432,
	        HumaneTotalDirectorySize: "32  MBytes",
	        Details: {
		        Raven.voron: {
			        FileSize: 33554432,
			        HumaneFileSize: "32 MBytes",
			        TotalMapped: 33554432,
			        HumaneTotalMapped: "32 MBytes",
			        Mappings: [
				        {
					        Size: 33554432,
					        Count: 1,
				        }
			        ],
		        }
	        },
        },
        {
		    Directory: "\Databases\Demo\Configuration",
		    TotalDirectorySize: 8388608,
		    HumaneTotalDirectorySize: "8 MBytes",
		    Details: {
			    Raven.voron: {
				    FileSize: 8388608,
				    HumaneFileSize: "8 MBytes",
				    TotalMapped: 8388608,
				    HumaneTotalMapped: "8 MBytes",
				    Mappings: [
					    {
						    Size: 8388608,
						    Count: 1,
					    }
				    ],
			    }
		    },
	    },
        {
	        Directory: "\Databases\Demo\Indexes\Product_Search\Temp",
	        TotalDirectorySize: 131072,
	        HumaneTotalDirectorySize: "128 KBytes",
	        Details: {
		        compression.0000000000.buffers: {
			        FileSize: 65536,
			        HumaneFileSize: "64 KBytes",
			        TotalMapped: 65536,
			        HumaneTotalMapped: "64 KBytes",
			        Mappings: [
				        {
				            Size: 65536,
				            Count: 1,
				        }
			        ],
		        },
		        scratch.0000000000.buffers: {
			        FileSize: 65536,
			        HumaneFileSize: "64 KBytes",
			        TotalMapped: 65536,
			        HumaneTotalMapped: "64 KBytes",
			        Mappings: [
				        {
				            Size: 65536,
				            Count: 1,
				        }
			        ],
		        },
	        },
        },

        ...
    ],
}
CPU Stats
To get server CPU stats use the {serverUrl}/admin/debug/cpu/stats endpoint
A document containing the following information is retrieved:
{
	CpuStats: [
		{
			ProcessName: "Raven.Server",
			ProcessorAffinity: 3,
			PrivilegedProcessorTime: "00:10:49.9843750",
			TotalProcessorTime: "00:57:11.9531250",
			UserProcessorTime: "00:46:21.9687500",
		}
	],
	ThreadPoolStats: [
		{
		AvailableThreadPoolWorkerThreads: 32765,
		AvailableThreadPoolCompletionPortThreads: 1000,
		MinThreadPoolWorkerThreads: 2,
		MinThreadPoolCompletionPortThreads: 2,
		MaxThreadPoolWorkerThreads: 32767,
		MaxThreadPoolCompletionPortThreads: 1000,
		}
	],
}
Database statistics
Database statistics are available in the Studio, and can also be retrieved by dedicated endpoints
or via the Client API (details here).
Database Statistics via the Studio
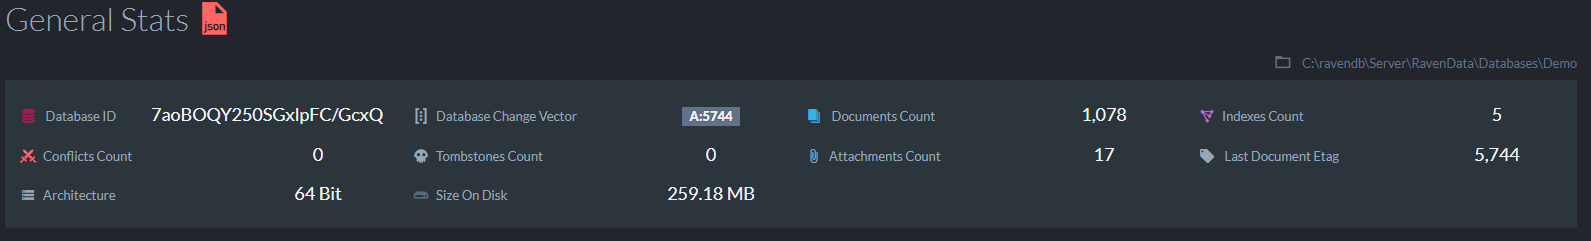
In the Studio, go to Databases, select a database and then go to Stats.
The following information is presented:
-
General Stats
- Database ID
- Database Change Vector
- Documents Count
- Indexes Count
- Conflicts Count
- Tombstones Count
- Attachments Count
- Last Document Etag
- Architecture
- Size On Disk
-
Indexes Stats
-
AutoMap
- Entries Count
- Map Attempts
- Map Successes
-
Map
- Entries Count
- Map Attempts
- Map Successes
- Mapped Per Second Rate
-
MapReduce
- Entries Count
- Map Attempts
- Map Successes**
- Mapped Per Second Rate
- Reduce Attempts
- Reduce Successes
- Reduced Per Second Rate
-
AutoMap
Database Statistics via Dedicated Endpoint
Database statistics can also be retrieved in a JSON format by using the
{serverUrl}/databases/{databaseName}/stats endpoint
A document containing the following database statistics is retrieved:
{
	CountOfIndexes: 4,
	CountOfDocuments: 1080,
	CountOfRevisionDocuments: 4645,
	CountOfTombstones: 0,
	CountOfDocumentsConflicts: 0,
	CountOfConflicts: 0,
	CountOfAttachments: 17,
	CountOfUniqueAttachments: 17,
	DatabaseChangeVector: "A:5746-7aoBOQY250SGxlpFC/GcxQ",
	DatabaseId: "7aoBOQY250SGxlpFC/GcxQ",
	NumberOfTransactionMergerQueueOperations: 0,
	Is64Bit: true,
	Pager: "Voron.Platform.Win32.WindowsMemoryMapPager",
	LastDocEtag: 5746,
	LastIndexingTime: "2018-04-16T09:38:28.8303222Z",
	SizeOnDisk: {
		HumaneSize: "259 MBytes",
		SizeInBytes: 271581184,
	},
	Indexes: [
		{
			IsStale: false,
			Name: "Auto/Companies/ByAddress.CountryAndSearch(Name)",
			LockMode: "Unlock",
			Priority: "Normal",
			State: "Normal",
			Type: "AutoMap",
			LastIndexingTime: "2018-04-16T09:38:28.8303222Z",
		},
		{
			IsStale: false,
			Name: "Auto/Employees/ByFirstNameAndLastName",
			LockMode: "Unlock",
			Priority: "Normal",
			State: "Idle",
			Type: "AutoMap",
			LastIndexingTime: "2018-04-16T09:38:28.7994098Z",
		},
		{
			IsStale: false,
			Name: "Orders/ByCompany",
			LockMode: "Unlock",
			Priority: "Normal",
			State: "Normal",
			Type: "MapReduce",
			LastIndexingTime: "2018-04-16T09:38:28.7270848Z",
		},
		{
			IsStale: false,
			Name: "Product/Search",
			LockMode: "Unlock",
			Priority: "Normal",
			State: "Normal",
			Type: "Map",
			LastIndexingTime: "2018-04-16T09:38:28.7761331Z",
		},
	],
}
Database Metrics
To get the database metrics use the {serverUrl}/databases/{databaseName}/metrics endpoint
Similarly to the server metrics endpoint, a document containing the following database metrics is retrieved:
-
Requests
- RequestsPerSec
- ConcurrentRequestsCount
-
Docs
- BytesPutsPerSec
- PutsPerSec
-
Attachments
- BytesPutsPerSec
- PutsPerSec
-
MapIndexes
- IndexedPerSec
-
MapReduceIndexes
- MappedPerSec
- ReducedPerSec
where each meter has the following format:
{
    Current: 3,
    Count: 217937,
    MeanRate: 0.2,
    OneMinuteRate: 1.2,
    FiveMinuteRate: 0.2,
    FifteenMinuteRate: 0.1
}