Skip to Navigation
Monitor your RavenDB instances using Grafana
Est. reading time: 1 min

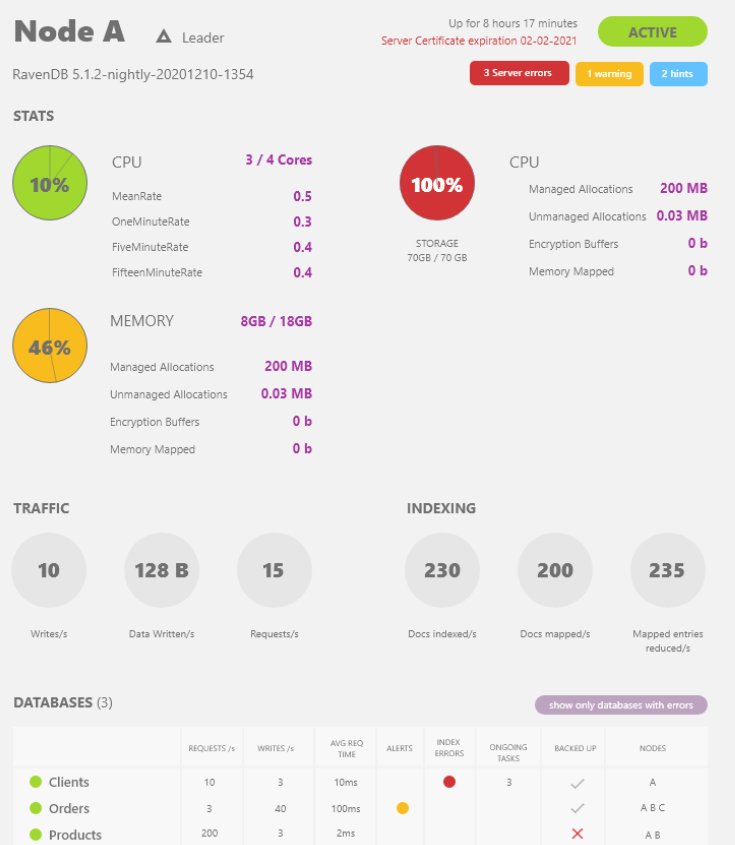
You can now get a Grafana dashboard that would monitor your RavenDB instances. You can use Telegraf 1.18.0+, which includes a RavenDB input plugin, which will expose all the relevant details.
You can see how that would look like:

This is part of the work we want to do in order to make it easier and smoother to operate your RavenDB clusters. It joins the work we do on the cluster dashboard as well as a host of other (mostly minor) changes.
Woah, already finished? 🤯
If you found the article interesting, don’t miss a chance to try our database solution – totally for free!