Production postmortem: The allocating query

A customer was experiencing large memory spikes in some cases, and we were looking into the allocation patterns of some of the queries that were involved. One of the things that popped up was a query that allocated just under 30GB of managed memory during its processing.
Let me repeat that, because it bears repeating. That query allocated 30(!) GB(!) during its execution. Now, that doesn’t mean that it was consuming 30 GB, it was just the allocations involved. Most of that memory was immediately discarded during the operation. But 30 GB of garbage to cleanup puts a lot of pressure on the system. We took a closer look at the offensive query. It looked something like this:
from index “Notifications/RoutingAndPriority”
where startsWith(Route, $routeKeyPrefix)
order by Priority desc
That does not seem like a query that should be all that expensive. But details matter, so we dove into this. For this particular query, the routes are hierarchical structures that are unique for each message. Something like:
- notifications/traffic/new-york-city/67a81019-941b-4d04-a0db-0559ed45343c
- notifications/emergency/las-vegas/0a8e18fb-563b-4b6a-8e93-e10e08239656
And the queries that were generated were using the city & topic to filter the information that they were interested in.
The customer in question had a lot of notifications going on at all times. And each one of their Routes was unique. Internally, RavenDB uses Lucene (currently ![]() ) to handle searches, and Lucene is using an inverse index to execute queries.
) to handle searches, and Lucene is using an inverse index to execute queries.
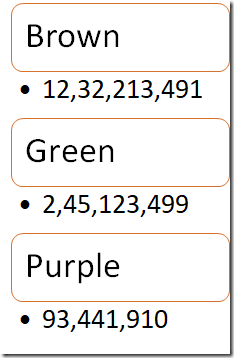
The usual way to think about is like this:
We have a list of terms (Brown, Green & Purple) and each of them has a list of the matching documents that contain the particular term.
The process of issuing a prefix query then is easy, scan all entries that match the prefix and return their results. This is indeed what Lucene is doing. However… while it is doing that, it will do something like this:
Pay close attention to what is actually happening here. There are two enumerators that we work with. One for the terms for the field and one for the documents for a specific term.
All of this is perfectly reasonable, but there is an issue. What happens when you have a lot of unique values? Well, then Lucene will have a lot of iterations of the loop. In this case, each term has just a single match, and Lucene is pretty good at optimizing search by specific term.
The actual problem is that Lucene allocates a string instance for each term. If we have 30 million notifications for New York’s traffic, that means that we’ll allocate 30 million strings during the processing of the query. We aren’t retaining these strings, mind. They’ll be cleaned up by the GC quickly enough, but that is an additional cost that we don’t actually want.
Luckily, in this case, there is a much simple solution. Given that the pattern of the route is known, we can skip the unique portion of the route. That means that in our index, we’ll do something similar to:
Route = doc.Route.Substring(0, doc.Route.LastIndexOf(‘/’) + 1)
Once that is done, the number of unique matches there would be negligible. There would be no more allocations galore to observe and overall system performance is much improved.
We looked into whether there is something that we can do with Lucene to avoid this allocations issue, but it is endemic to the way the API works. The longer term plan is to fix that completely, of course. We are making great strides there already ![]() .
.
In short, if you are doing startsWith() queries or similar, pay attention to the number of unique terms that you have to go through. A simple optimization on the index like the one above can bring quite a bit of dividends.
Woah, already finished? 🤯
If you found the article interesting, don’t miss a chance to try our database solution – totally for free!


