
High Quality Ravens: The work of the QA team in RavenDB
Introduction
This article explores the comprehensive performance monitoring workflow employed by the RavenDB QA team to maintain the efficiency and reliability of RavenDB. From orchestrating tests execution to visualizing performance metrics and synthesizing data into actionable insights, our QA process leverages sophisticated tools and methodologies.
Our objective: proactively identify and report performance bottlenecks, ensuring no performance degradation and the ongoing optimization of RavenDB.
Our Workflow
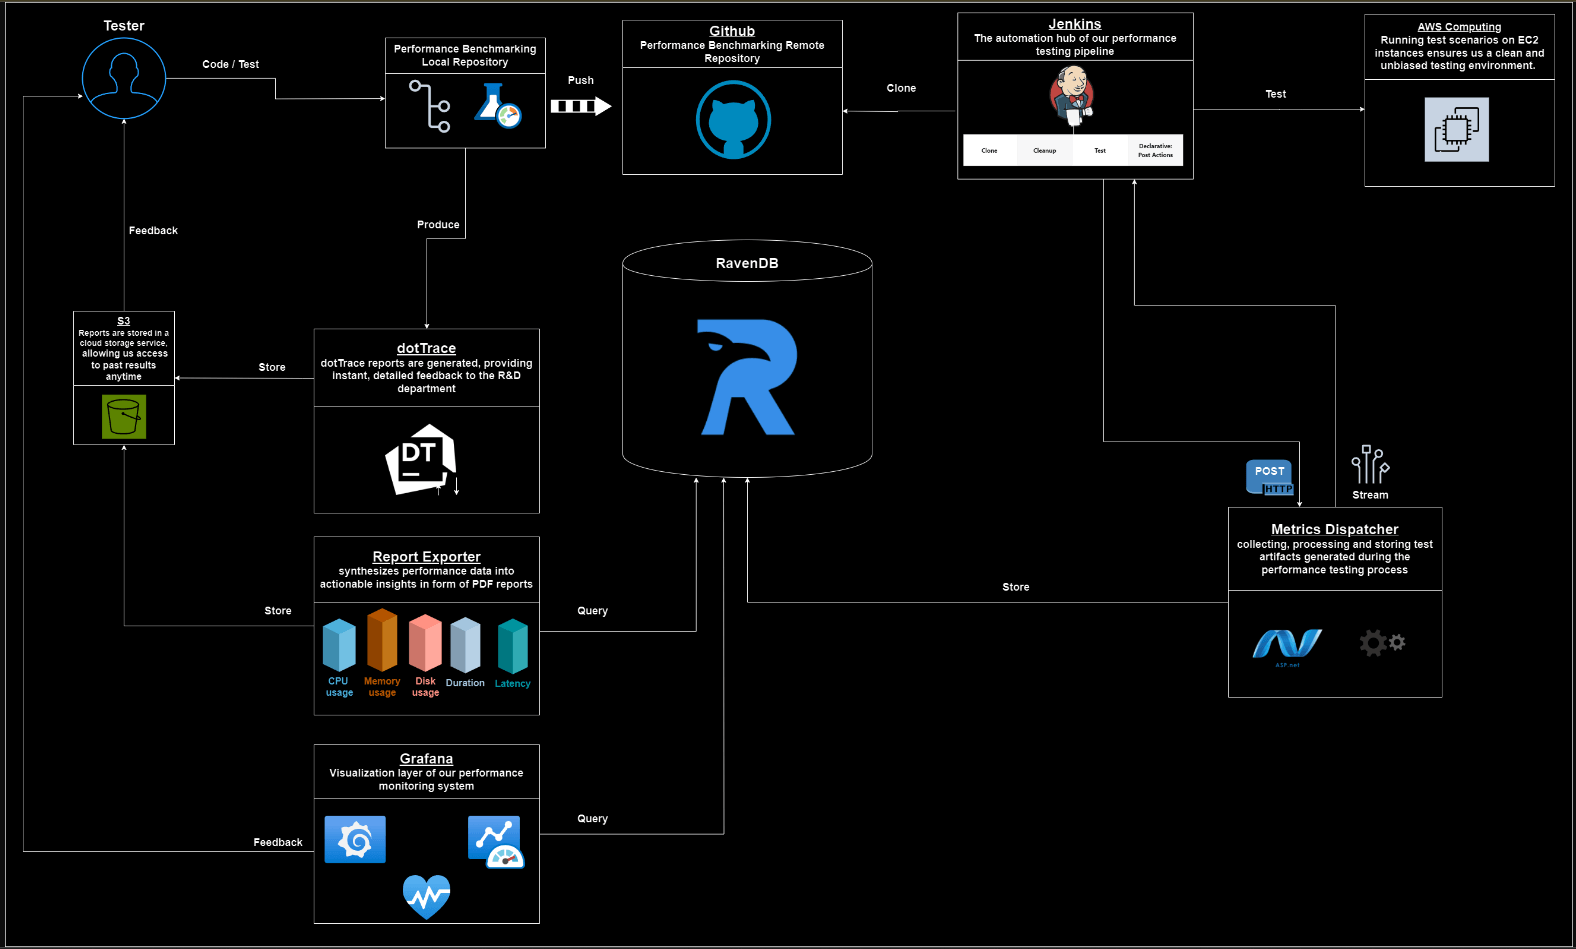
Performance Benchmarking
The Performance Benchmarking Repository is the cornerstone of our performance testing strategy. It contains a collection of meticulously crafted scripts designed to simulate various scenarios and workload conditions, ensuring comprehensive coverage and early identification of potential performance bottlenecks.
Each scenario within the repository is tailored to test specific fundamental operations and features of the database, such as CRUD (Create, Read, Update, Delete) operations, complex queries, or transactions, ensuring a comprehensive evaluation of RavenDB’s capabilities across a spectrum of essential functionalities. For an in-depth performance analysis and to explore our selected scenario suite, please refer to our performance page.
By encompassing a wide range of use cases, we ensure thorough test coverage and the early detection of performance issues and optimizing resource utilization. Each scenario simulates real-world conditions with the database setup on EC2 instances to ensure a clean and unbiased testing environment.
Our testing includes configurations such as a single server, a cluster of servers, and a sharded database distributed across a cluster. These varied setups allow us to evaluate RavenDB’s performance under different operational conditions. The scripts, implemented in both Bash and C# using the Raven Client library, offers flexibility and compatibility with different environments.
Leveraging the WRK Tool
These scripts utilize the wrk tool to apply load on the API. Specifically, we use the wrk2 tool. WRK is an HTTP benchmarking tool designed to generate significant load on web servers. It is particularly useful for performance testing due to its ability to utilize multiple parameters, simulating real-world usage scenarios.
Key factors include:
Connections (-c): Specifies the number of concurrent connections to maintain during the test. WRK keeps these connections open and reuses them to send multiple requests, simulating multiple users interacting with the server concurrently.Threads (-t): Specifies the number of threads to use. Each thread handles a subset of the total connections, distributing the load and leveraging multi-core processors.Requests per Second (-r): Controls the rate at which requests are sent, ensuring a consistent and controlled load. This prevents the server from being overwhelmed and allows for more accurate benchmarking.script (-s) :wrk supports executing a LuaJIT script, which allows for complex scenarios and custom logic to be incorporated into the benchmarking process.
Basic Usage:
wrk -t 8 -c 256 -d 1m http://125.214.96.190:8080This runs a benchmark for 1 minute, using 8 threads, and keeping 256 HTTP connections open. We use a combination of connections, threads and controlled request rates to generate a realistic and consistent load on the server. Each thread, managing a portion of the connections, runs in a loop generating HTTP requests.
The requests are distributed evenly across the connections, and if a connection is busy or delayed, the thread uses another available connection. The illustration below shows this situation:
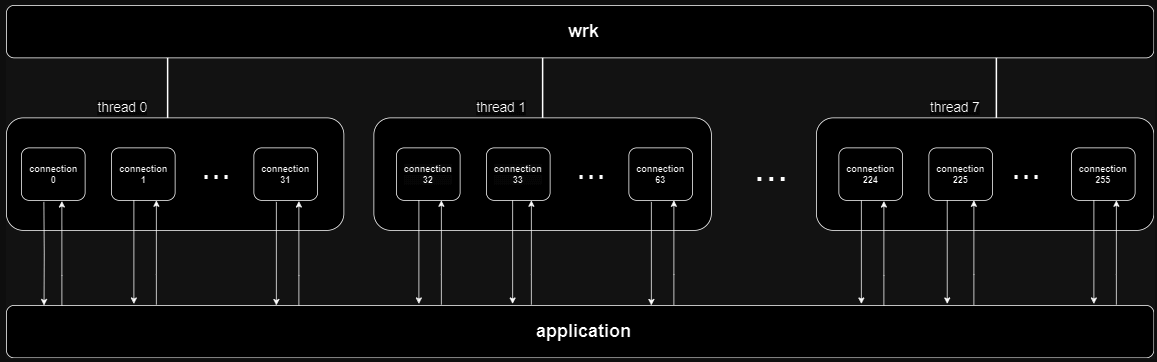
This can also be described as 256 users that request our home page repeatedly for one minute. After setting up the database with test data, it is ready for benchmarking. Let’s examine a real test scenario extracted from our test suites:
wrk -L -d 1m -c 256 -t 8 --timeout 30s -r 15000 -s pipeline.lua http://125.214.96.190:8080 -- 4 ../where_queries.reqs-d: Duration of the test is set to 1 minute.-c: 256 concurrent connections.-t: 8 threads to distribute the load.--timeout: 30-second timeout for each request.-r: Requests per second limited to 15,000.-s :Lua script to customize request generation and handling.http://125.214.96.190:8080: Target URL.-- 4 ../where_queries.reqs: Additional arguments for the Lua script.
Wrk supports the use of LuaJIT scripts to add custom logic to the benchmarking process. In this example, the pipeline.lua script is used to send requests in a pipelined manner, where 4 requests are sent at once. This method of request batching is essential to fully load RavenDB, simulating high concurrency and intensive workloads.
Notably, in our queries scenarios, we do not use the RavenDB Client API. Instead, we directly send HTTP requests to the server. By sending HTTP requests directly, we eliminate any potential overhead or optimizations introduced by the client API, thereby obtaining a more accurate measure of the server’s raw performance capabilities. We have to take this option because the RavenDB client & server will conspire behind our back to cache whatever is possible. For our performance benchmarks, we want to ensure that we are putting the server in as challenging a position as we can.
The requests file (e.g. where_queries.reqs) contains specific queries to be sent as a payload to the server. Here is what its content looks like:
{"Query":"from index 'Users/DisplayNames' where DisplayName = \"omer ratsaby\" select Views","Start":0,"PageSize":101,"DisableCaching":true,"QueryParameters":{}}

{"Query":"from index 'Users/DisplayNames' where DisplayName = \"haroon\" select Views","Start":0,"PageSize":101,"DisableCaching":true,"QueryParameters":{}}

{"Query":"from index 'Users/DisplayNames' where DisplayName = \"drhazzard\" select Views","Start":0,"PageSize":101,"DisableCaching":true,"QueryParameters":{}}
As you can see, we are providing queries in the same format RavenDB expect to read from the network. And those queries are each different. We intentionally don’t use parameterized queries, since this force the server to re-compute the query each time, rather than try to use a cache. Our performance testing is very much unfair to RavenDB, the idea is that we expect the server to provide great performance even in the worst case scenarios.
We run the wrk command multiple times for each querying scenario to determine the optimal Requests Per Second. Requests Per Second or RPS is a metric commonly used in performance testing to measure the rate at which a system handles incoming requests within a given time frame. It indicates the throughput or capacity of a system to process requests. We employ automation scripts to determine the optimal RPS for each scenario, running the wrk command multiple times. These scripts analyze the generated latency reports ascertain the optimal RPS setting. We define ‘optimal RPS’ as the maximum RPS achievable while ensuring that 99% of queries are completed in less than 80ms and 99.9% of queries have a response time under 200ms. Automating this process, allows us to quickly identify the ideal RPS without manual intervention.
During these tests, another process records metrics of the host machine running RavenDB for further analysis. Upon completion, WRK provides a detailed latency report:
Running 1m test @ http://125.214.96.190:8080
8 threads and 256 connections
Thread calibration: mean lat.: 35.220ms, rate sampling interval: 259ms
Thread calibration: mean lat.: 34.088ms, rate sampling interval: 255ms
Thread calibration: mean lat.: 30.792ms, rate sampling interval: 222ms
Thread calibration: mean lat.: 29.520ms, rate sampling interval: 202ms
Thread calibration: mean lat.: 32.991ms, rate sampling interval: 228ms
Thread calibration: mean lat.: 31.482ms, rate sampling interval: 219ms
Thread calibration: mean lat.: 29.604ms, rate sampling interval: 211ms
Thread calibration: mean lat.: 33.614ms, rate sampling interval: 239ms
Thread Stats Avg Stdev Max +/- Stdev

Latency 5.28ms 5.29ms 128.00ms 90.20%
Req/Sec 2.00k 64.65 2.57k 76.52%

Latency Distribution (HdrHistogram - Recorded Latency)
50.000% 3.18ms
75.000% 7.86ms
90.000% 10.53ms
99.000% 22.85ms
99.900% 59.01ms
99.990% 86.14ms
99.999% 117.63ms
100.000% 128.06ms

Detailed Percentile spectrum:
Value Percentile TotalCount 1/(1-Percentile)
0.327 0.000000 1 1.00
1.339 0.100000 79877 1.11
...
128.063 1.000000 797451 inf

#[Mean = 5.277, StdDeviation = 5.291]
#[Max = 128.000, Total count = 797451]
#[Buckets = 27, SubBuckets = 2048]
----------------------------------------------------------
959122 requests in 1.00m, 866.68MB read
Requests/sec: 15984.36
A QA team member reviews both the latency and metrics reports to ensure:
- The system meets stringent standards for response times.
- Specifically, these criteria mandate that 99% of queries should be completed in less than 80ms, while 99.9% of queries should have a response time under 200ms.
- No anomalies or suspicious metrics values are present.
- 3. There is no performance regression compared to past results across multiple builds.
Benchmarking Against Competitors:
We also have several mini-projects dedicated to benchmarking our database against competitors such as MongoDB, Couchbase, and PostgreSQL. These projects involve comprehensive comparisons across basic test scenarios, including querying efficiency, indexing performance, and utilization of their respective client libraries.
DotTrace Support:
The Performance Benchmarking Repository supports generating dotTrace reports for detailed performance profiling and analysis. This helps identify code areas contributing to latency or resource consumption, facilitating targeted optimization efforts.
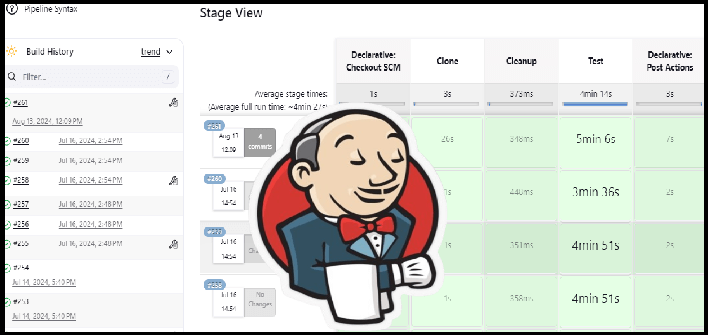
Test Automation
We are achieving rapid testing using Jenkins and our Metrics Dispatcher service. Jenkins serves as the automation hub for our performance testing pipeline, orchestrating the execution of test scenarios. Within Jenkins, jobs are defined for each scenario, allowing for parallel execution and efficient resource utilization.
The Metrics Dispatcher processes and stores test artifacts generated during the performance testing process on Jenkins. When notified by Jenkins that a job is complete, the Metrics Dispatcher establishes a communication channel with Jenkins to retrieve the relevant artifacts. These artifacts, which typically include system metrics and latency reports, are then processed and stored in a RavenDB instance.
The Jenkins jobs are run periodically once a week, covering a wide range of different scenarios and features on our nightly builds. The results from these Jenkins jobs are carefully examined to ensure there are no regressions and to identify any anomalies.
Monitor, Feedback and Report
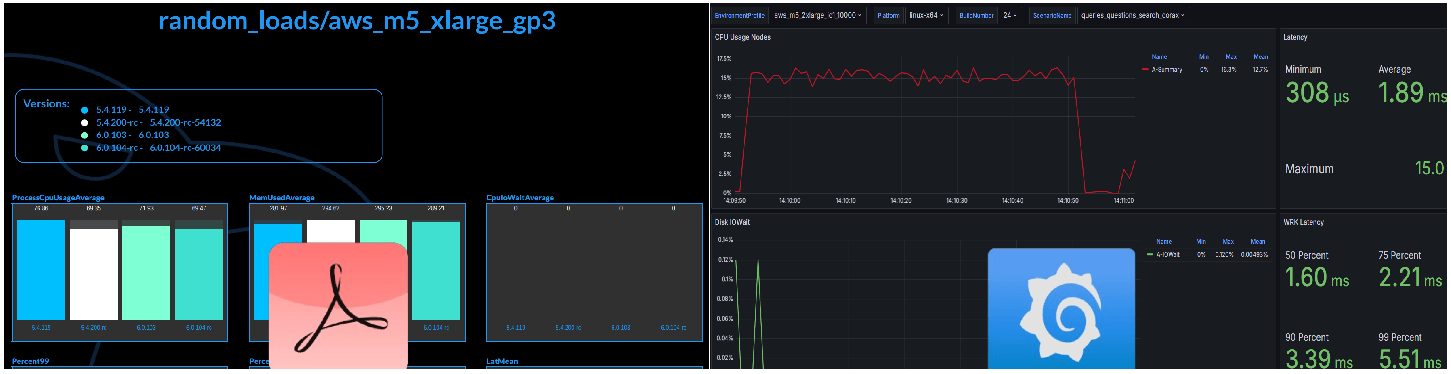
The monitoring and reporting process is designed to provide rapid feedback to our Research and Development (R&D) teams, emphasizing speed, automation, and accuracy. To achieve these goals, we utilize several tools, including Grafana and our custom Report-Exporter.
Grafana serves as the visualization layer of our performance monitoring system, offering real-time insights into system metrics and trends. Each scenario in our performance testing repository corresponds to a dedicated dashboard in Grafana, displaying key performance indicators and metrics over time. Grafana periodically queries the RavenDB database to fetch updated data, enabling dynamic visualization of performance trends.
The Report Exporter component synthesizes performance data into actionable insights, facilitating informed decision-making and optimization efforts. Implemented as a standalone service, it generates performance comparison reports based on data collected from Jenkins, RavenDB, and Grafana. These reports provide a comprehensive overview of system performance, highlighting key metrics such as throughput, latency, and resource utilization. By comparing performance across different scenarios and versions, the Report Exporter helps us identify trends, anomalies, and areas for improvement.
By producing these performance comparison reports, it offers valuable feedback to the R&D teams, guiding decision-making processes aimed at enhancing system performance and reliability.
Conclusion
In conclusion, these proccesses forms the backbone of our performance monitoring workflow, ensuring the continuous optimization of RavenDB. By leveraging sophisticated tools and methodologies, the QA team can proactively identify and address performance bottlenecks, thereby delivering exceptional user experiences and driving RavenDB success.
Woah, already finished? 🤯
If you found the article interesting, don’t miss a chance to try our database solution – totally for free!


