
What you will learn
- What is OpenTelemetry and why you want to use it
- How RavenDB integrates with OpenTelemetry
- How to set up OpenTelemetry Collector with RavenDB and push metrics to the Prometheus
General
The best definition what is OpenTelemetry can be found on OpenTelemetry official website:
OpenTelemetry is a collection of APIs, SDKs, and tools. Use it to instrument, generate, collect, and export telemetry data (metrics, logs, and traces) to help you analyze your software’s performance and behavior.
Since version 6.2 we’re supporting OpenTelemetry (metrics only) in RavenDB. You can take leverage of it to monitor your instances of RavenDB and keep an eye on your database.
How does it work
At the very beginning I want to explain the terminology which will be used in this article for better understanding. Let’s start with the lowest – the metric instruments. Metric instrument is defined by Name, Kind, Unit (optional), and Description (optional) and it observes some value.
Metrics instruments are aggregated under meters – you can imagine that single meter aggregates similar or related instruments which gives a possibility to group by them.
What is available via OpenTelemetry in RavenDB
We are exposing the following meters: ravendb.server.cpucredits, ravendb.server.gc, ravendb.server.general, ravendb.server.requests, ravendb.server.resources, ravendb.server.storage, ravendb.server.totaldatabases and also we take leverage of built-in meters built inside .NET Runtime and AspNetCore, which provide deep insights into what is happening inside your database instance. You can find more detailed information about it here.
How to run OpenTelemetry inside RavenDB
Enabling the OpenTelemetry in RavenDB requires setting a single configuration option (see how): Monitoring.OpenTelemetry.Enabled as true in settings.json.
Please remember to restart RavenDB since initialization must be done during the process start.
How OpenTelemetry Collector is pulling metrics
We started OpenTelemetry but where do the metrics go? Currently, the default option is to export them via OpenTelemetryProtocol configured with default values. You can also output them to the console (via config) but let’s focus on OpenTelemetryProtocol which is more usable for production systems. Please note that the configuration of OpenTelemetryProtocol is available in our configuration (see more at RavenDB Docs).
Retrieving OpenTelemetry data
The most recommended tool is called OpenTelemetry Collector which is developed by the OpenTelemetry project. It allows you to retrieve, export, and process the metrics inside it and towards metrics aggregator software like Prometheus. Installation can be done via docker or a standalone application. A tutorial is available here.
After installation you’ve to configure it.
In standalone application you can pass it as yml configuration file:
Let’s discuss the most basic configuration file (with default ports used by RavenDB)
receivers:
    otlp:
      protocols:
        grpc:
          endpoint: localhost:4317
        http:
          endpoint: localhost:4318
  processors:
    batch:
  exporters:
    debug:
      verbosity: detailed
  service:
    pipelines:
      metrics:
        receivers: [otlp]
        processors: [batch]
        exporters: [debug]
This configuration allows you to receive metrics from RavenDB and print them in the console.
To run it:
$ .\otelcol-contrib.exe --config .\otel-config.ymlAfter some time, you should see the following in your console output:
Resource attributes:
       -> service.name: Str(server)
       -> service.namespace: Str(ravendb)
       -> service.instance.id: Str(A)
       -> telemetry.sdk.name: Str(opentelemetry)
       -> telemetry.sdk.language: Str(dotnet)
       -> telemetry.sdk.version: Str(1.9.0)
  ScopeMetrics #0
  ScopeMetrics SchemaURL:
  InstrumentationScope ravendb.server.general
  Metric #0
  Descriptor:
       -> Name: ravendb.server.general.cluster.node.state
       -> Description: Current node state
       -> Unit:
       -> DataType: Sum
       -> IsMonotonic: false
       -> AggregationTemporality: Cumulative
  NumberDataPoints #0
  StartTimestamp: 2024-07-24 13:54:26.9271387 +0000 UTC
  Timestamp: 2024-07-24 13:57:26.8713221 +0000 UTC
  Value: 4
  [... MORE ...]
Now you’ve correctly configured the OpenTelemetry inside RavenDB and in the Collector to receive the metrics. This is only half-way to our goal and that now we need to push them to our destination – monitoring software e.g. Prometheus. You can transform the data (see more at OpenTelemetryCollector Processor) and push it to your favorite metric holder software like Prometheus.
Adding Prometheus to the OpenTelemetry Collector
We’ve to configure the address for the prometheus to get the metrics. Let’s open again our OpenTelemetryCollector configuration file and in the `exporters` section of the OpenTelemetry Collector you have to define prometheus:
exporters:
    debug:
      verbosity: detailed
    prometheus:
      endpoint: "127.0.0.1:8889"
And then you have to add the prometheus in service:
service:
    pipelines:
      metrics:
        receivers: [otlp]
        processors: [batch]
        exporters: [prometheus, debug]
Example configuration – Prometheus
Prometheus is a software application used for event monitoring. You can get it from their website: https://prometheus.io/
Let me show how to configure exporting metrics from a Collector to a local Prometheus instance.
To make it simpler to you I will use default prometheus settings to show the process.
The default address of your local Prometheus is http://localhost:9090.
Before we run Prometheus we’ve to add a scrape configuration where our metrics from OpenTelemetryCollector will be pushed. In order to configure it open the prometheus.yml
file in prometheus directory and in scrape_configs add:
- job_name: 'otel-collector'
      static_configs:
        - targets: ['localhost:8889']
Save and run. To confirm everything is working as well you can go to the Status -> Targets and check if your endpoint is UP:
To find out if your Prometheus is listening you can go to the Status -> Targets and check if everything is working:
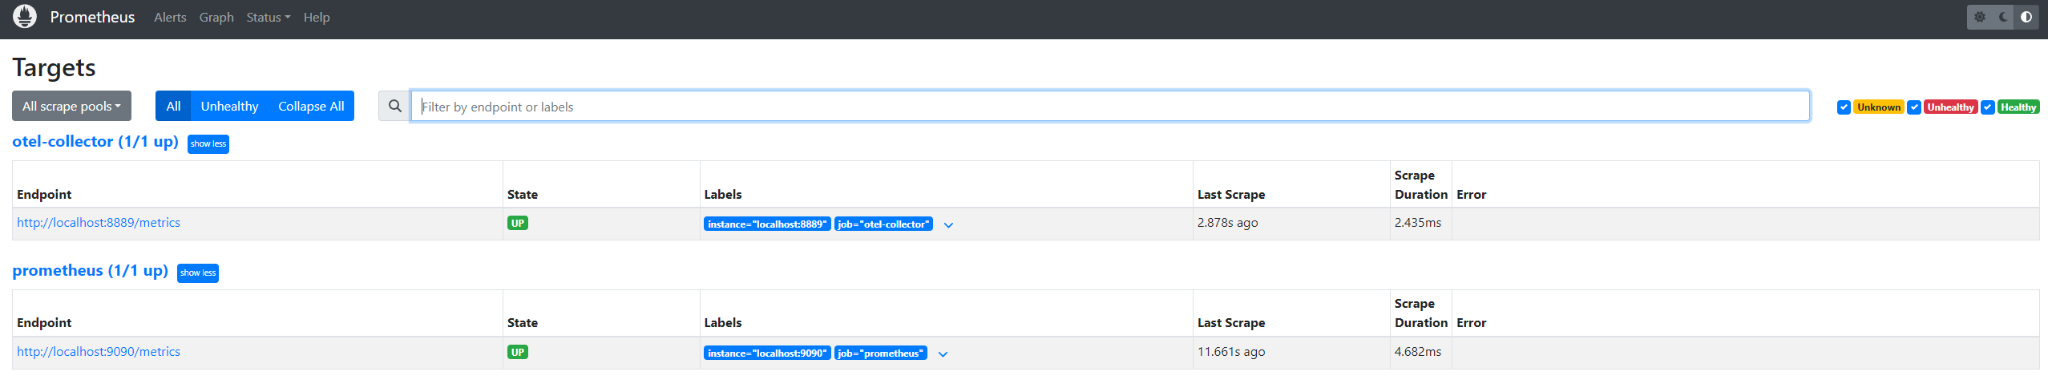
When you see the status is UP, the job is done in Prometheus. Then you can go to your You can remove debug as part of exporter.
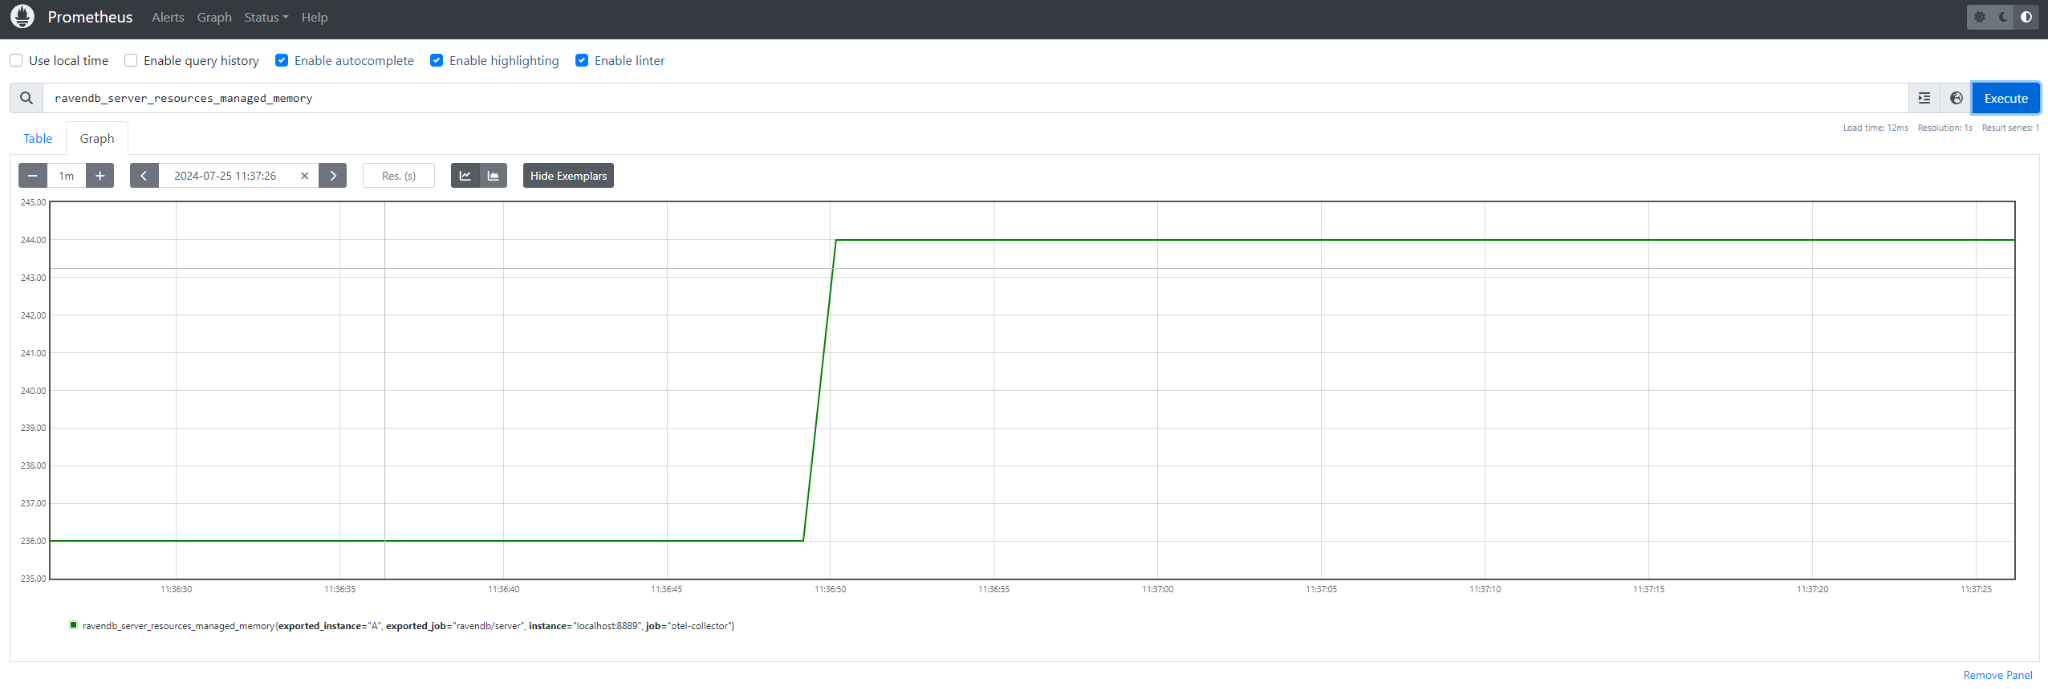
Restart your OpenTelemetry collector to apply new configuration and wait for the data inside your prometheus:
Summary
In the example above, we talked about what OpenTelemetry is and how to start it inside RavenDB. Then we went through an example configuration of OpenTelemetry Collector, which is a recommended tool for receiving, transforming, and exporting your metrics to other applications. We also covered Prometheus, which is a very popular tool for storing metrics. I hope this article gives some insights into what OpenTelemetry is about and how to use it.
Woah, already finished? 🤯
If you found the article interesting, don’t miss a chance to try our database solution – totally for free!


