RavenDB Document Database Management Studio
The RavenDB NoSQL Document Database Management Studio is the Apple of Databases, and you don’t need to pay extra or waste time and effort attaching it as an addon. It’s a native part of RavenDB that comes free with every license: Community, Professional, and Enterprise.
The Management Studio is a fully loaded graphical user interface (GUI) that monitors both operational and performance metrics of your database. You can perform most functions without online commands – just point and click. Monitor in real time how much disk space you are utilizing, disk i/o, disk memory, computer memory, and network bandwidth to see whether or not you are getting 100% out of the resources you paid for either on premises or in the cloud.
Easily pinpoint bottlenecks to keep the database layer of your application in peak performance at all times. RavenDB maintains a live log of all your events to isolate any potential issues – making troubleshooting a snap.
You can also create just about anything you need through the studio. You can set up databases, nodes, collections, and even create and edit documents at the interface level. Connect remotely to your database from any browser anywhere and do whatever you need to maintain your data. Even if you are new to RavenDB or database admin, the Management Studio lets you navigate like a pro with its easy to use dashboard.
Create code, set up queries, monitor indexes and MapReduce aggregates in our all-in-one interface.
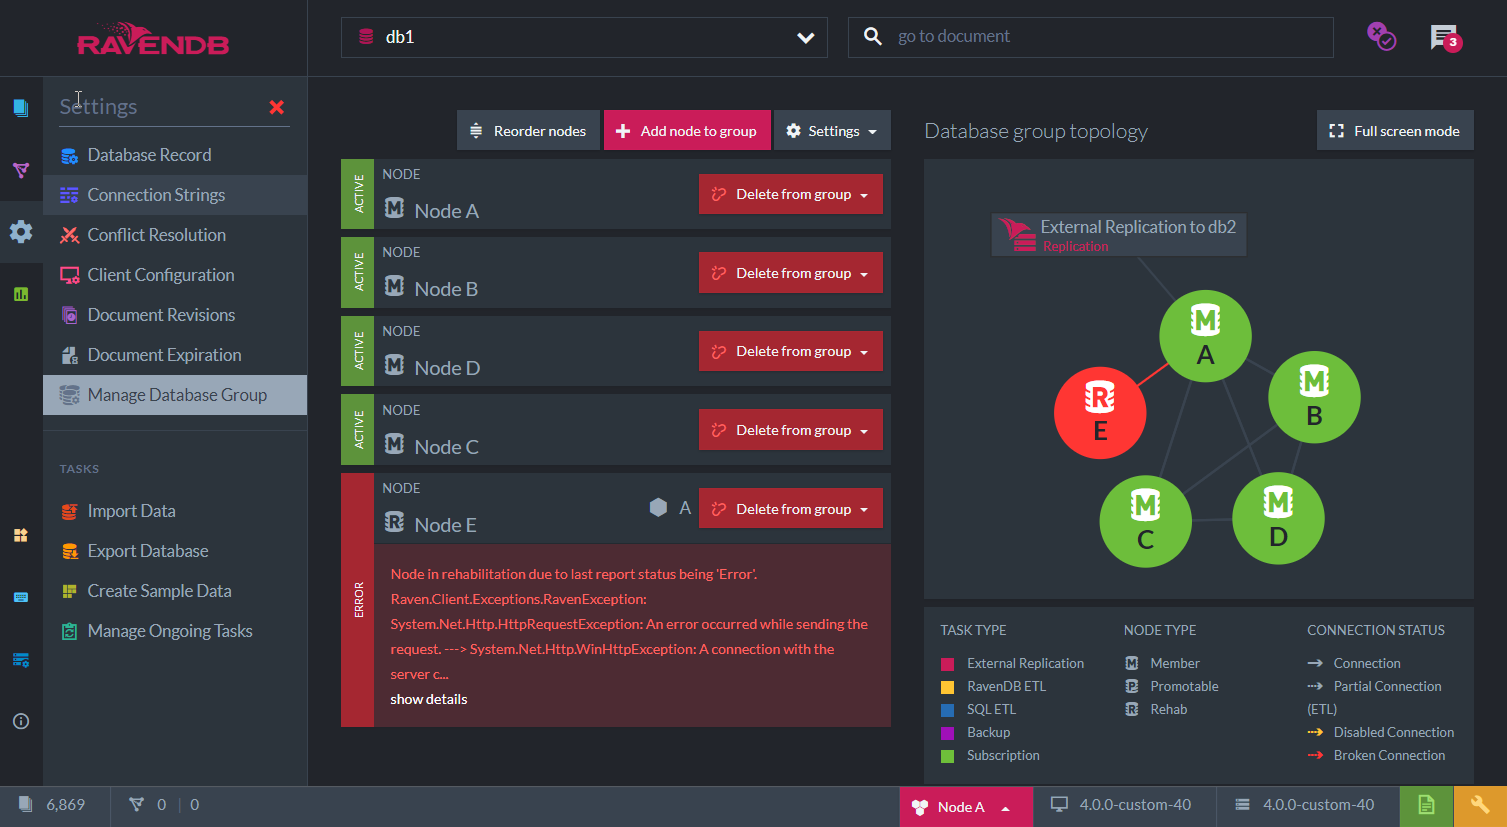
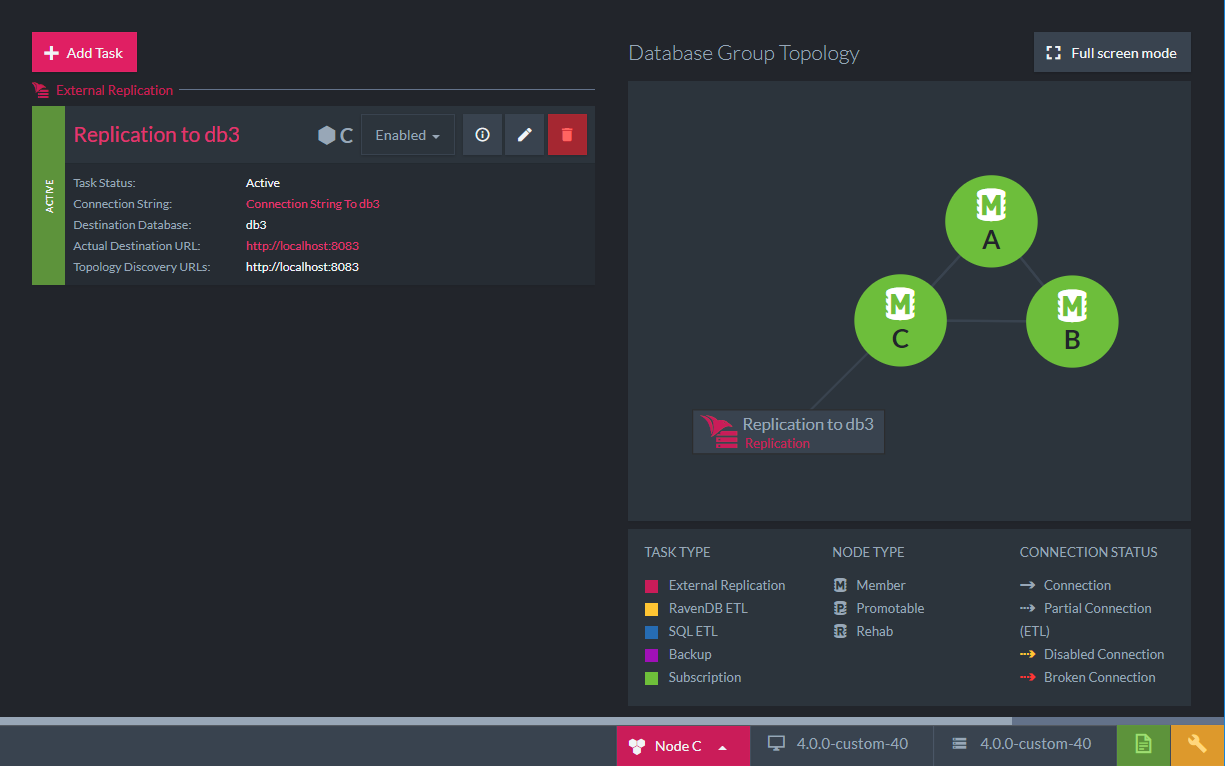
For a distributed database, your database topology consists of databases and nodes that make up your cluster. At any moment, you can see which nodes are carrying what databases. You can also see which server locations the nodes are hosted on. Monitor what tasks each are performing, who are the lead nodes, and to where ETL processes are replicating to.
If a node goes down or a new node becomes the leader of the cluster, you will be the first to know.

Follow Extensive Logging and Incident Reporting
The Studio will also track operation logs, taking records of all the actions going on in your database. It also records debug information about what is currently going on the server, providing you insights about the functionality of the server itself.
If you have slow reads, it will show in the log files. Things like small batch files, or any type of issue will appear. This gives you the data you need to break open bottlenecks and resolve issues the moment they appear.
From the studio you can also download debug logs and send it to RavenDB support engineers who will isolate areas for improvement even faster.
Indexes
Using the Management Studio, you can see both static-indexes, those you set up, and auto-indexes – indexes RavenDB will set up automatically to make your queries run faster. RavenDB will only perform queries based on an index to maximize performance. When a query is made, it will look for an index, improve upon one, or create one itself to best fulfill the request. Using the studio, you can see what your database made to speed up your application.
You can see which indexes are applied to which databases, how they are performing, and what steps need to be taken, if any, to further optimize how you cull your data.
MapReduce Helps Sort and Analyze Big Data
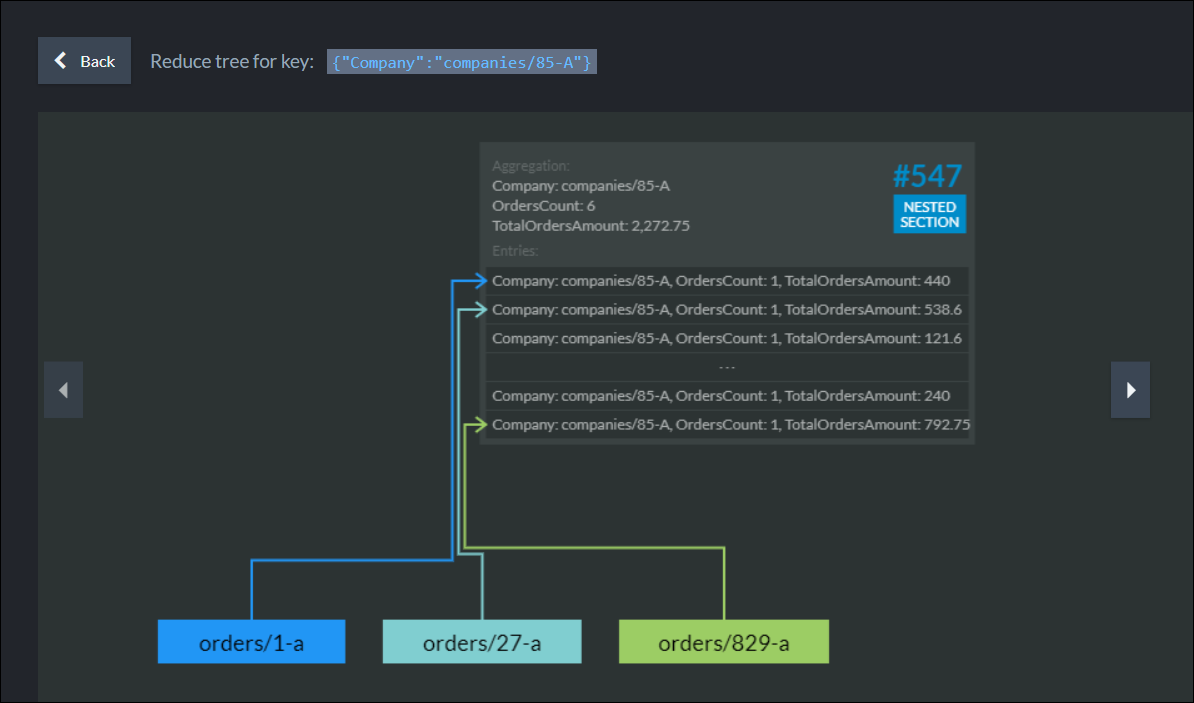
Monitor Big Data with our MapReduce Visualizer that lets you track the progress of data aggregations step by step. It graphs the relations between your documents and aggregate results.
You can see the documents that went into each aggregation individually or segmented. You can also monitor how long each step in the Map and Reduce process took to determine performance bumps that can be quickly smoothed.
The Studio Lets You See the RavenDB Document Database in Action
Once you execute your requests, you can see all of the data returned right on the screen. It can be data sets, aggregations results, performance results for indexes and reads or writes per second, even memory utilized during the operations.
Once the data set appears, you can click on the collections or documents and drill down. For each document, you can see the requested columns, or the document itself. You can also click on the attachments to see which files were added to the document.
This can be a health care application where you want X-rays and test results as part of the patient’s info, or it can be an advertising platform where you want the actual graphics to accompany sales information for a campaign. The possibilities are endless.
What You Can Create in Your Studio
The Management Studio is more than monitoring. You can run your entire data system off it. With a point and a click you can set up a new regular or encrypted database. You can create new documents and assign them to a specific collection. If the documents you need to make are very similar to those in a particular collection, you can clone new documents that are duplicates of other documents and edit from there.
Using the studio, you can perform queries, create indexes, patch bundles of documents, and when it is all done, you can see the results and export them to a CSV file.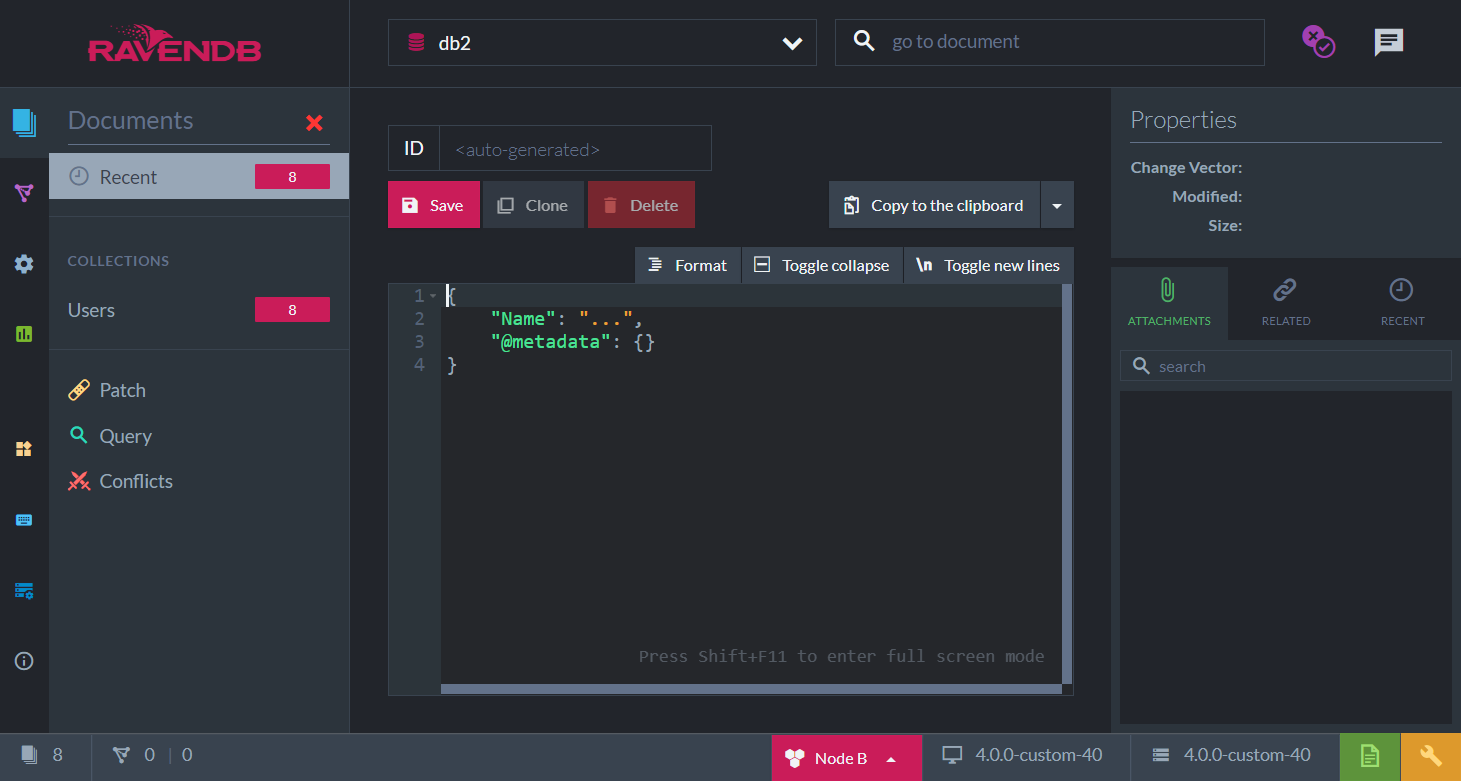
For aggregations, you can create MapReduce indexes where you see the results and the segments or even documents that comprise them.
Distributed Database Clusterwide Capabilities
As a distributed database, you need functionality to manage your database cluster. That includes creating new nodes to your cluster and assigning the right databases to them. It also means connecting the node to the right server and assigning its status as a leader, mentor, or watcher. To guarantee each node has the memory it needs to function at peak performance, you can even decide how many cores to assign them. You also have the ability to remove a node.
You also have the option to configure a database independently from the cluster, giving it a custom-made environment with which to operate.
With your NoSQL Document Database Management Studio you control everything. You can perform these operations without a command line.
Keep Everyone Busy with Tasks
In the Studio, working with SQL databases and other nonrelational applications is a breeze. You can migrate your data from SQL into RavenDB thereby converting it into a Document format. At the click of a button you can upgrade your data assets from pen and paper technology to the 21st century.
You can also create an ongoing ETL to push RavenDB data to an SQL database. This is ideal for analytics, taking in data as a document and pushing it where it can be optimally visualized.
Define work tasks to be done by your database on an ongoing basis. It can be external replication to another cluster, an on-prem server or in the cloud. It can be to a relational or another nonrelational database. Data replication can go anywhere you send it.
You can set the task and set the node responsible for the task. If that node were to go offline, RavenDB will automatically reassign those tasks to functioning nodes.


