Skip to Navigation
What’s New RavenDB 5.2

Intro
- Analyze the performance of your business using 3rd party software via OLAP ETL to see how it serves your enterprise needs.
- Utilize RavenDB’s Telegraf Plugin and Grafana Template to monitor your database using a Grafana Dashboard.
- Take a peek at your cluster health using our Cluster Dashboard.
- Assure cluster availability and robustness using Rolling Index Deployment.
- Easily manage Custom Analyzers using Studio.
- Permit partial client access using Read-Only Certificates.
- Enjoy a boost in Spatial Queries performance and a graphical display of their results.
- Analyze Data Subscription Tasks performance using our live performance statistics view.
OLAP ETL
In addition to our ability to perform ETL (Extract, Transform, Load) to SQL databases and to other RavenDB servers, we now offer OLAP ETL.
OLAP (OnLine Analytical Processing) refers to the practice of analyzing your data and the performance of your system to see how it serves the needs of your enterprise. Typically this means much more complex and heavy queries. RavenDB’s OLAP ETL translates your data to the Parquet format, which is analogous to CSV or JSON, but is orders of magnitude faster to query. OLAP ETL then sends your data to one of a few destinations that are ideal for analytical purposes. One of these destinations is an AWS S3 bucket where your data can then be queried using AWS Athena. Another option is to send data to Azure Blob Storage, where it can be queried using Azure Data Lake, and so on.
Custom Analyzers
RavenDB has supported full-text search for a long time now. This relies on text analyzers, which use various methods to split text into the tokens that can then be searched. RavenDB comes with several Lucene analyzers out of the box. You can also create and import your own custom analyzers, but previously it required manually adding it as a file in RavenDB’s folder structure.
Version 5.2 simplifies this process considerably. Analyzers are now automatically synchronized among all cluster nodes and can be written and edited directly in the Studio through a new dedicated interface.
Fine-Tuned Access with Certificates
Our databases can accommodate many kinds of users and administrators, each with their own needs and privileges. Have you ever wanted to give a user permission to read from a database, but not to write new data? Now you can! The new Read-Only access level allows a client to perform read operations (such as viewing documents, performing queries, or using data subscriptions) but not to create or modify documents, change the database’s configurations, or set a server’s ongoing tasks. The same Client Certificate can grant different levels of access for each database – from no access at all, to ‘admin’.
This is coupled with improvements to the Studio UI that ensure that each user always knows exactly what their level of access allows them to do in each database. For example: in read-only mode the buttons for parts of the Studio that the user can’t access are colored grey, buttons that are normally for ‘editing’ become buttons for ‘viewing’, and so on.
Telegraf & Grafana Integration
We have developed a new plugin for Telegraf – a server agent that collects data and metrics from your database. The RavenDB plugin collects dozens of useful metrics about server behavior, clusters, indexing, and more. These include things like your server’s CPU usage, the progress of your indexes, or the chatter between the servers in your cluster.
We have also created a Grafana template for RavenDB. Grafana is a visual dashboard that displays data from Telegraf as graphs in real-time, giving you more insight than ever before into the inner workings of your database.
Spatial Data
RavenDB’s advanced support for spatial data spans nearly a decade, allowing users to search for documents by geographic locations included in their properties. For example, a spatial query can retrieve the profiles of companies that are located within a specified region in the state of Kansas.
Improved Performance
For version 5.2, we’ve gone under the hood and rebuilt a lot of our spatial capabilities. Along with some new features, we’ve been able to drastically improve performance. Indexing speed for spatial data is up to 30% faster, and querying speed is up to 20% faster!
Map View
RavenDB 5.2’s Studio identifies queries whose results include spatial data and presents queried regions and retrieved locations in a special Map View. You can zoom out for an overview and in for details, see multiple search regions in different colors, and toggle various display options for easier visibility and discoverability.
Rolling Index Deployment
RavenDB’s fully automated indexing is one of the keys to its extraordinary performance, allowing the acceleration of data retrieval by executing queries over pre-prepared indexes rather than ever-repeating cumbersome full scans.
But heavy-duty indexing operations may become a burden for the cluster if all nodes are busy indexing at the same time.
- On Site, the toll concurrent indexing takes on nodes’ storage and CPU usage may decrease the cluster’s performance.
- On the Cloud, concurrent indexing may exhaust all nodes’ credits at the same time and leave too few or even none of the nodes available for service.
Starting with RavenDB 5.2 you can use Rolling Index Deployment to deploy indexing gradually, one node at a time. While one of the nodes surrenders its resources to indexing, the cluster may reassign its tasks to other nodes if needed.
Keeping indexing as efficient as ever, Rolling Index Deployment leaves the cluster at its peak performance and availability at all times.
Advanced Studio Statistics
RavenDB’s Studio helps you decrease operability and development costs with a multitude of statistics tools with which you can pinpoint any problem and focus your efforts efficiently. To these tools, we have now added a dedicated adjustable Cluster Dashboard and a graphical view of your Data Subscriptions tasks stats.
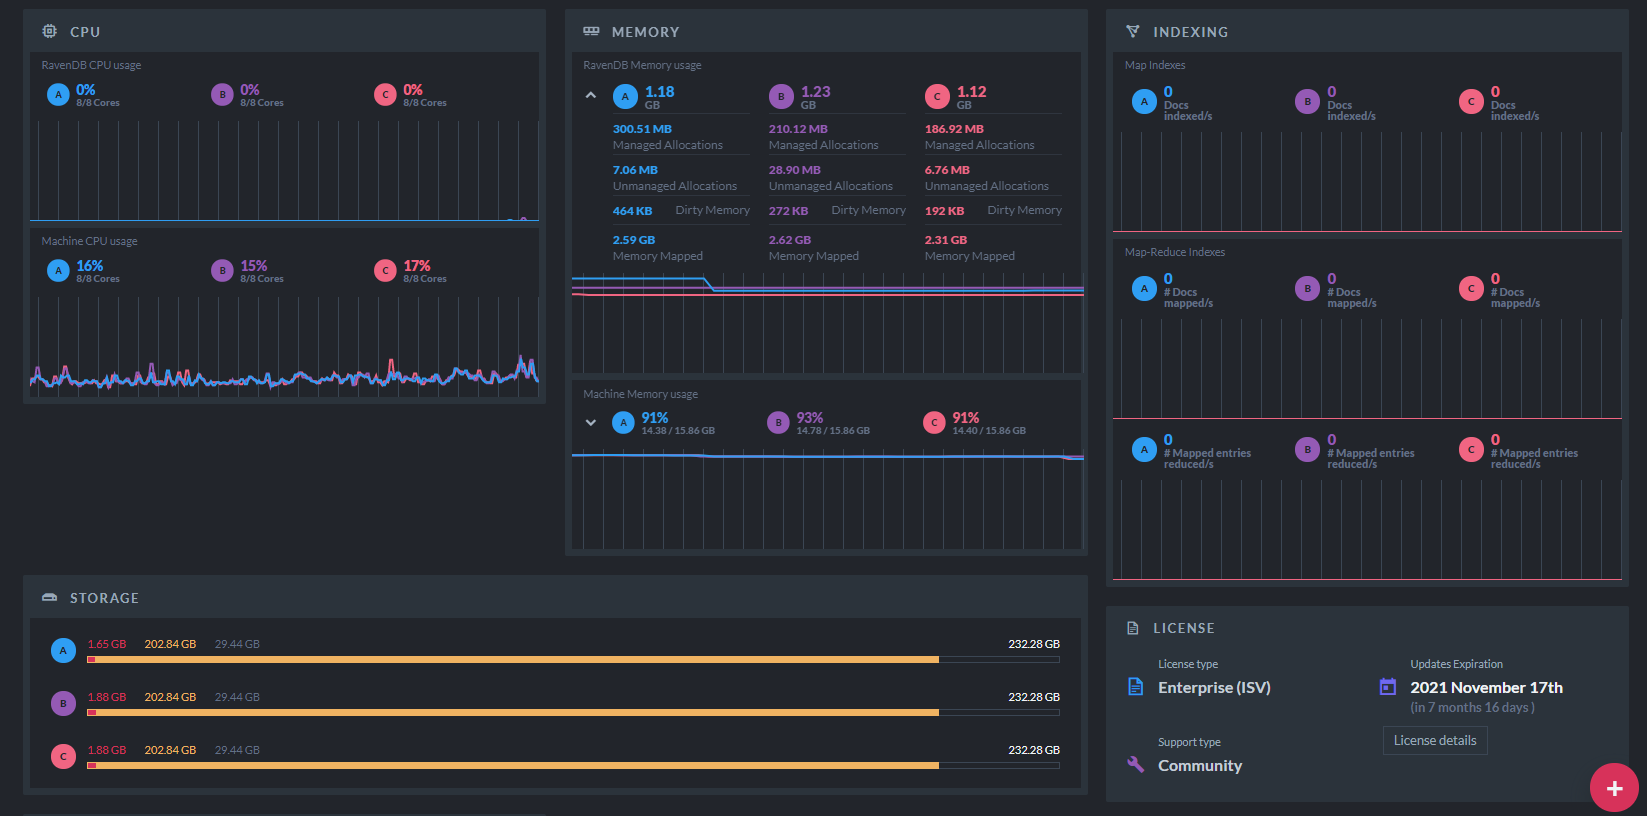
Adjustable Cluster Dashboard
When you open the Studio interface of a freshly installed RavenDB, your first view is that of the Server Dashboard, which conveniently gathers and presents the server’s configuration and live statistics. You can always return to this page to display, among other statistics, the server’s current CPU and memory usage, its indexing activities, and its traffic volume.
But RavenDB is a distributed database and is often deployed as a multi-node cluster. How then can you efficiently monitor all of its nodes at once and assess its operability as a whole? RavenDB 5.2 provides a state-of-the-art solution to this puzzle in its new adjustable Cluster Dashboard. You can not only display data related to all cluster nodes in this view but also fully personalize it.
Widgets containing cluster info and live statistics can be freely added, removed, relocated, and resized, so the dashboard would display just the information you want to see in just the way you want to see it.
Since each widget displays statistics for all nodes, you can easily compare the operability of your nodes in various aspects. The traffic and CPU widgets, for example, provide you with an instant comparison of the traffic volume and CPU usage of the different nodes and clarify whether you need to take steps like distributing your workload differently or upgrading a node.
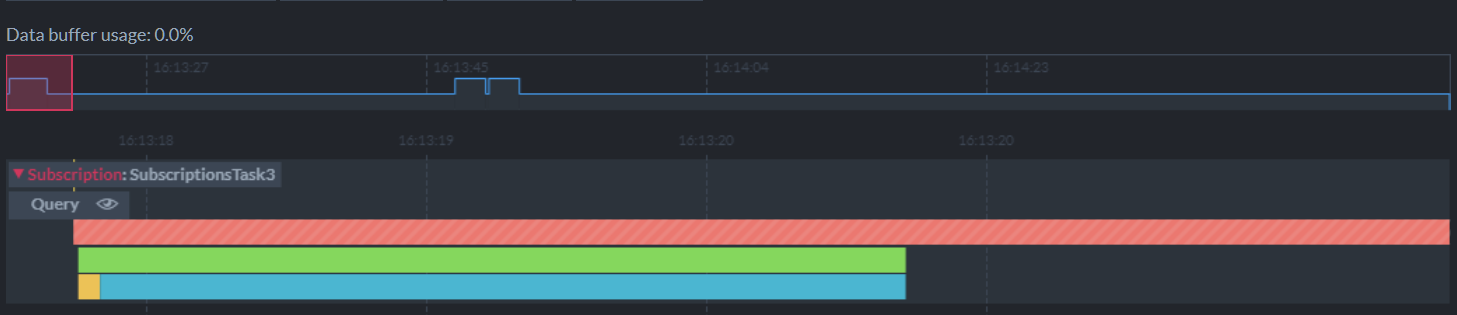
Data Subscription Stats
Monitoring ongoing tasks like Replication and ETL is made easy using Studio’s Ongoing Tasks Stats view, which offers a graphic display of task-related operations over a continuous timeline. You can choose the tasks you want to observe, scroll the timeline for a history of their activity, zoom in to magnify a specific incident or zoom out for a broader overview.
A data subscription task is an ongoing operation in which the cluster sends document batches to a client in an orderly manner, waiting for the consumption of each batch before sending the next. Documents transmitted this way may be, for example, orders sent to an accountant-client, making an otherwise tedious operation extremely easy to manage.
RavenDB 5.2 adds Data Subscriptions to the list of tasks that can be monitored using the Ongoing Tasks Stats View. Having the subscription task in this view provides you with a clear understanding of its conduct at a glance, and makes further inquiries much simpler. You can instantly spot activity peaks and lows on the timeline, magnify chosen time segments, and find whether a problem lies with the server or the client (e.g. by checking if the client had acknowledged batch reception before processing has halted).
CHANGELOG
- Take a look at a complete RavenDB 5.2 changelog here.