Architectural optimizations vs the profiler

For the past couple of years, we had a stealth project going on inside of RavenDB. That project is meant to re-architect the internals of how RavenDB handles queries. The goal is to have a major performance improvement for RavenDB indexing and queries.
We spent a lot of time thinking about architecting this. Design discussions for this feature goes back to 2015, to give you some context. The codename for this project is: Corax.
Recently we finished wiring the new engine into RavenDB and for the first time in a long while, we could actually do a comparative benchmark between the two implementations. For this post, I’m going to focus solely on indexing performance, by the way.
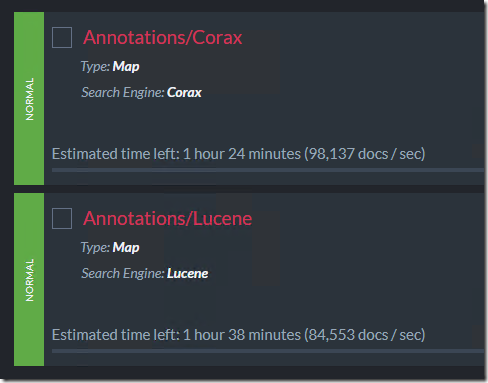
Here is a couple of (very simple) indexes working on indexing a 497 million documents.
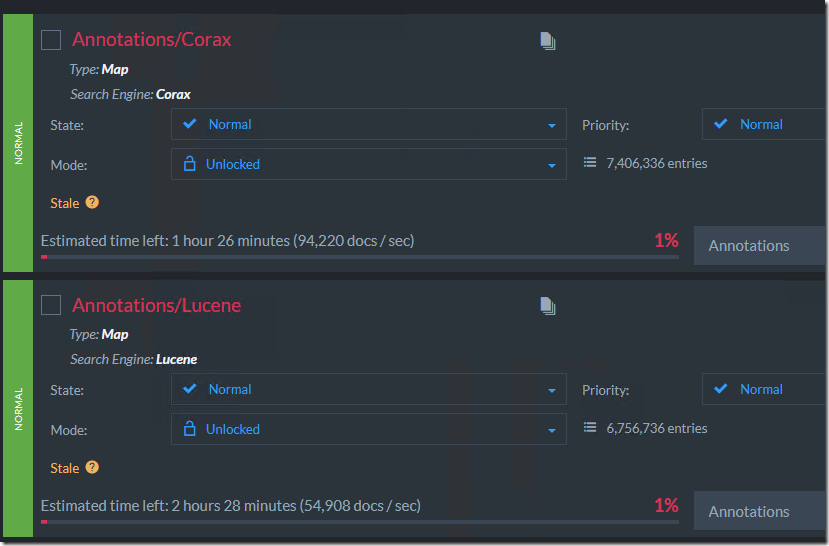
You can see that the numbers are pretty good, but we just started. Here is what the numbers look like after about 7 million documents being indexed:
You can see that Corax already opened up quite a gap between the two engines.
As a reminder, we have been optimizing our indexing process with Lucene for literally over a decade. We have done a lot to make things fast. Corax is still beating Lucene quite handily.
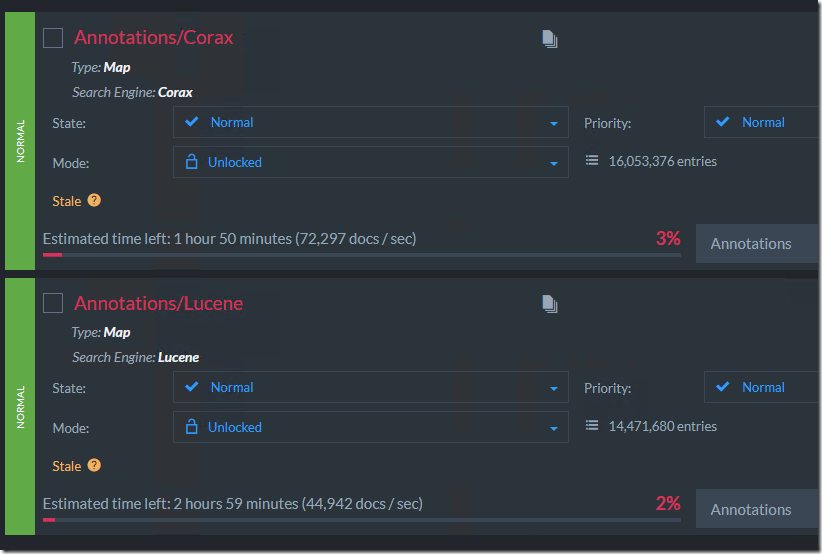
However, let’s take a look here, so far we indexed ~16 million documents and we can see that we are slowing down a bit:
That actually makes sense, we are doing quite a lot of work around here. It is hard to maintain the same speed when you aren’t working on a blank slate.
However, Corax was architected for speed, so while we weren’t surprised by the overall performance, we wanted more. We started analyzing what is going on. Quite quickly we figured out a truly stupendous issue in Corax.
One of the biggest problems when competing with Lucene is that it is a great library. It has certain design tradeoffs that I don’t like, but the key issue is that you can’t just build your own solution. You need to match or exceed whatever Lucene is doing.
One of the design decisions that has a major impact on how Lucene operates is that it is using an LSM model (log structured merge). This means that it writes data to immutable files (segments) and merge them occasionally. That means that handling deletes in Lucene is naturally handled during those merges. It means that Lucene can get away with tracking a lot less data about the entries that it indexed. That reduces the overall disk space it requires.
Corax takes a different approach, we don’t do compaction, because that lead to occasional spikes in computes and I/O needs. Instead, Corax uses a steady progress model. That means that it needs to track more data than Lucene.
Our first Corax indexes took about 5 – 10 times more disk space than Lucene. That isn’t a percentage, that is five to ten times bigger. One of the ways we handle this is to use an adaptive compression algorithm. We look at the entries that are being indexed and compress them. We don’t do that blindly, we generate a dictionary to match the actual entries at hand and are able to achieve some spectacular compression rate. Corax still uses more disk space than Lucene, but now the difference is in percentages, rather than in multiples.
On a regular basis, we’ll also check if the type of data that is being indexed has changed and we need to re-compute the dictionary. It turns out that we did that using a random sampling of the entries in the index. The number of samples range from 1 in 10 to 1 in 100, depending on the size of the index.
Then we threw a half billion index entries at Corax, and merely checking whether the dictionary could be better would result in us computing a dictionary with over 5 million entries. That was easily fixed, thankfully. We need to limit the scan not just in proportion to the size of the index but also globally. We can rely on the random nature of the sampling to give us a better dictionary next time, if needed. And it won’t stall the indexing process.
After jumping over the most obvious hurdles, the next stage is to pull the profiler and see what kind of bottlenecks we have in the system. Here is the first thing that popped out to me:
Over 10% of the indexing time is spent on adding an item to CollectionOfBloomFilters, what is that?
Well, remember how I said that Lucene optimized its file structure to handle deletes better? One of the consequences of that is that deletes can be really expensive. If you are indexing a new document (which doesn’t need to delete), you can have a significant time saving by skipping that. This is the rule of the bloom filter here. Yes, even with that cost, for Lucene it is worth it.
10.75% performance boost
Next… we have this dude:
That call is meant to update the number of records that Corax is holding in the index. We are updating a persistent value once for each entry that is indexed. But we can do that once for the entire batch!
2.81% performance boost
Those are easy, no? What is next?
For each term that we run, we rent and return a buffer. For each term! That alone takes 1% of the indexing time. Utterly ridiculous. We can use a single buffer for the entire indexing operation, after all.
As for the IsAnalayzed property? That does some (trivial) computation, but we know that the value is immutable. Make that once in the constructor and turn that property into a field.
1.33% performance boost
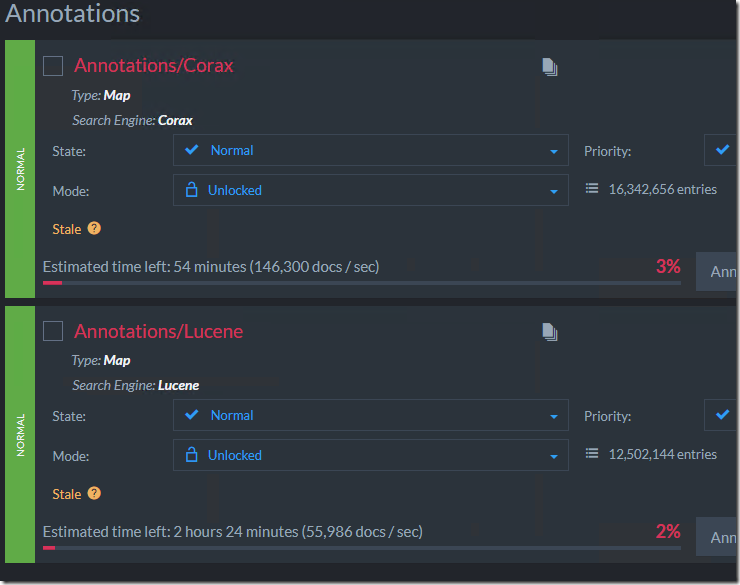
Those are literally just the things we noticed in the first few minutes. After applying those changes, I reset the indexing and looked at the results after it ran for a while. And now that, I’ll admit, is far more gratifying.
It is really interesting to see the impact of seemingly minor changes like those. Especially because the architecture holds up quite well.
Corax is proceeding quite well and we have really great hopes for it. We need to hammer on it a bit more, but it is showing a lot of promise.
The really interesting thing is that all those changes (which ended up pretty much doubling the effective indexing speed) are all relatively minor and easily fixed. That is despite the fact that we wrote Corax to be optimized, you always find surprises when you run the profiler, and sometimes they are very pleasant ones.
Woah, already finished? 🤯
If you found the article interesting, don’t miss a chance to try our database solution – totally for free!


