Server Dashboard
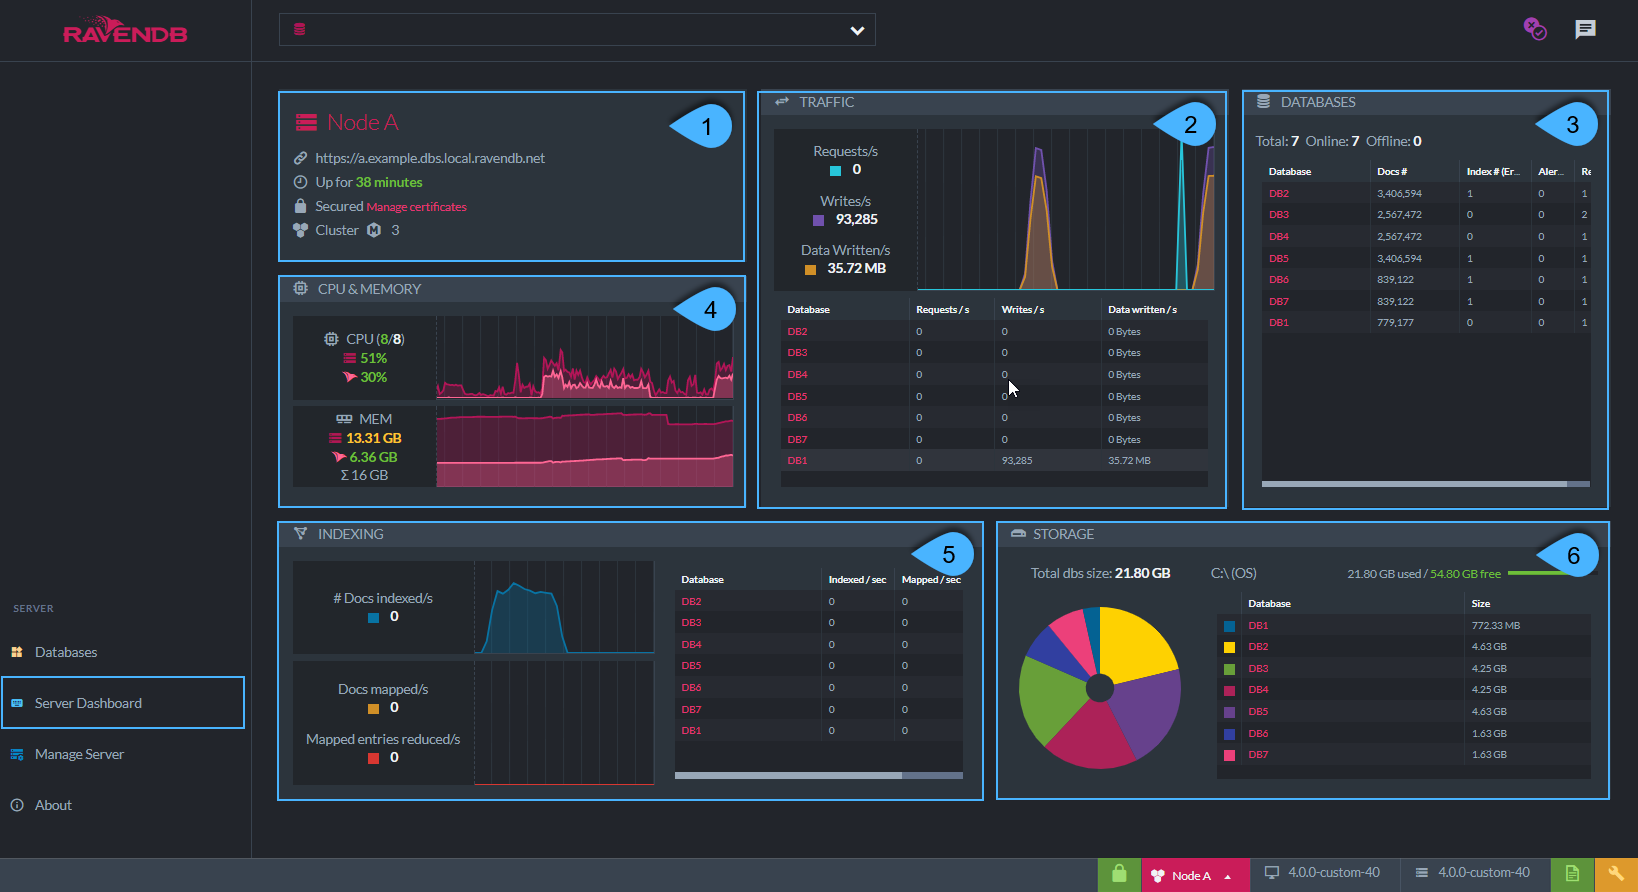
This dashboard provides a diagnostic overview of the RavenDB server performance and databases state.
The Server Dashboard

Server Dashboard
-
Server Node Details:
Data about the running server such as:- The server IP address
- Time it is up and running
- Secured info
- Number of members in cluster
-
Traffic:
- Requests - Number of requests handled by the server
- Writes/s - Documents count written per sec by the server
- Data written/s - Number of bytes written by the server to disk
-
Databases:
Databases summary - number of documents, indexes, alerts & replica factor -
CPU & Memory:
CPU & memory usage by the machine and by RavenDB -
Indexing:
- Number of documents indexed per second with detailed info about mapped and reduced actions
- Showing total documents and per database
-
Storage:
Databases size on disk