Ongoing Tasks Stats: Overview
-
The Ongoing Tasks Stats view monitors the following ongoing tasks:
- External Replication
- RavenDB ETL
- SQL ETL
- OLAP ETL
- Subscription
-
Tasks activities are graphically displayed for selected time frames.
-
In this page:
Ongoing Tasks Stats View

Ongoing Tasks Stats View
-
Ongoing Tasks Stats
Click to open the Ongoing Tasks Stats View. -
Database
Select the database whose ongoing tasks you want to monitor.
Data for this database's ongoing tasks will be collected and presented in the graph. -
Filter
Filter the displayed tasks by the task's name (Subscription, RavenDB ETL, SQL ETL, OLAP ETL) or by the target URL (External Replication). -
Export
The currently viewed graph data can be exported to a *.json file. -
Import
Import file to view a previously exported graph data.
No new data is collected & displayed when showing imported data.
Stats Graph

Ongoing Tasks Stats Graph
- The graph is added to the view once data is collected from at least one of the monitored tasks.
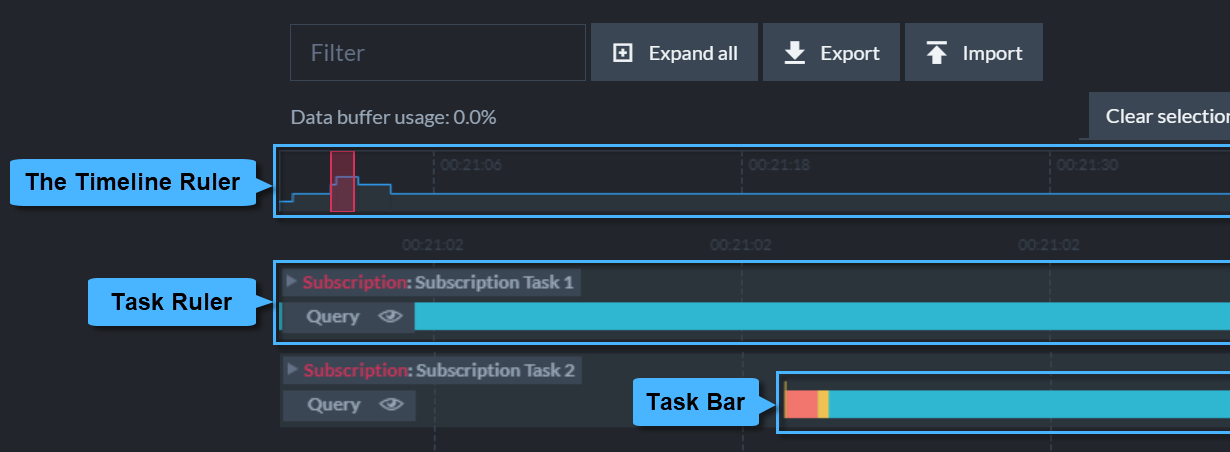
The Timeline Ruler

The Timeline Ruler
- Selected Time Frame
Select any timeline segment to explore the displayed tasks' activities during this time frame.
Click & drag or resize this frame to select different time frames for which the data will be shown in the graph. - Timeline Ruler Line
The timeline rulerLinedepicts the activity for all tasks presented in the graph. - Timeline Grid
A grid of timestamp-labled vertical time lines provides points of reference by which time frames can be selected. - Clear Selection
Click to clear the selected frame. - Clear Graph
Click to clear all the collected data from the graph.
Recently collected statistics are kept by RavenDB in memory, allowing you to refresh the stats view without losing its entire history.
Using theClear Graphbutton will clear all historical data.

Tail Stream End
- 6. Monitoring (tail -f)
When this option is checked, the selected time frame will be continuously reallocated at the end of the data stream.
Task Rulers
Each monitored task has its dedicated ruler that displays the task's activities during the time specified by the timeline ruler above.
Task Ruler Closed View

Task Ruler Closed Views
- Selected Time Frame
-
Task Ruler: Closed View
- Information summary is shown in a single bar.
-
Task Bar
- Hover over the bar to popup task information.
- Click and drag the bar to slide the graph.
- Zoom in & out using the mouse wheel.
- Click the bar for an expanded view that details task events in multiple bars.
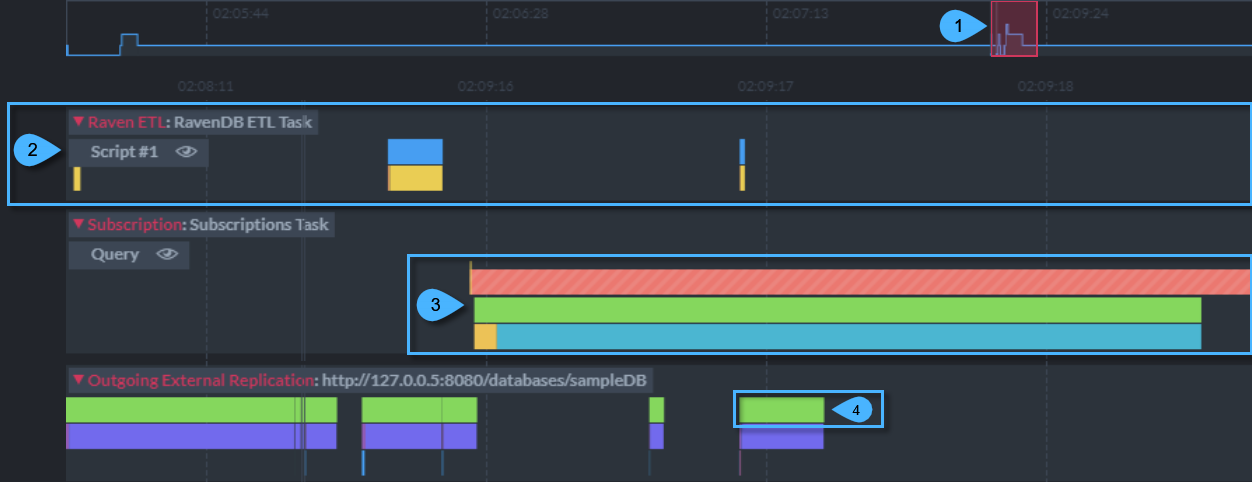
Task Ruler Expanded View

Task Ruler Expanded Views
- Selected Time Frame
- Task Ruler: Expanded View
Detailed information is shown in multiple bars. -
Task Bars
- Bars are split into frames that depict particular statistics related to the task.
- Hover over each bar frame to popup related information.
See the dedicated tasks stats articles for task-specific information. - Click and drag to slide the graph.
- Zoom in & out using the mouse wheel.
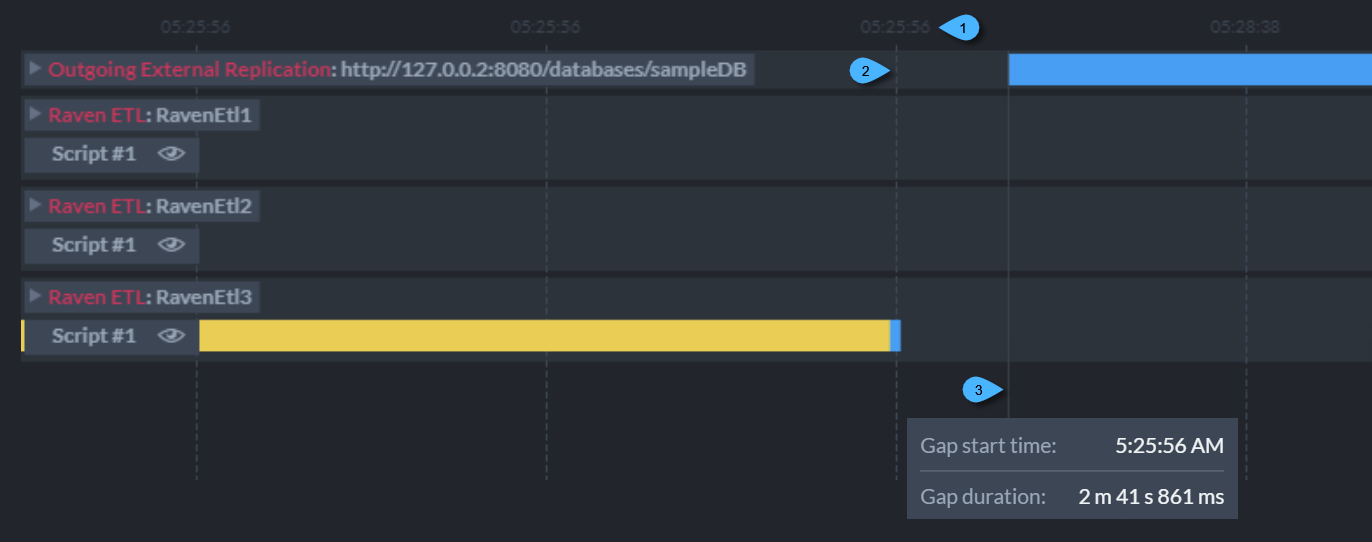
Task Rulers Time Grid
A grid of vertical time lines allows you to easily relate task events to their time of occurence.
Note that the stats graph displays two different time grids.
- The Timeline ruler time grid shows time points across the entire timeline ruler line.
- The Task rulers time grid, discussed here, shows points of time
within the selected time frame.

Task Rulers Time Grid
- Grid Line Timestamp
Time-grid lines are labled with timestamps. - Grid Line
Time grid lines are displayed as vertical dotted lines. -
Gap Line
Gap lines, displayed as vertical continuous lines, indicate the renewal of task activity after a period in which all tasks were idle.- Hover over the gap line to show a tooltip that details the idle period start time and duration.
Active and Inactive Display
Active tasks (e.g. a subscription task that a client is currently connected to) and Inactive tasks are shown in different styles.
- An active task:

- An inactive task:
