Skip to Navigation
Monitoring, troubleshooting and disaster recovery
We talked about deploying to production in the previous chapter, but just being in production is only half the job. The other half is ensuring that your systems are up, running and answering queries faster than your SLA thresholds.
In this chapter, we'll cover how to tell that your RavenDB cluster is healthy, how to monitor its state over time and what to do if any issues pop up.
Even before getting the production deployment ready, you need to plan how you'll monitor what's going on in RavenDB. The first thing you see when you go to the RavenDB Studio in a browser is the dashboard view, giving you the most-important details about what's going on in this specific RavenDB instance. This dashboard shows you crucial details, such as the number of requests, CPU load, memory utilization, indexing rate, etc.
The dashboard view was designed so you can just throw it on a monitor somewhere and take a peek every so often to measure the health of your system. If you have nothing else to guide you, just looking at the dashboard should still give you some idea about what's happening on a particular node.
The problem with relying on only the RavenDB dashboard is that it's limited to what's going on only right now, and only on one node. This view isn't so useful if you want to capture aggregated statistics across your cluster, for example, including historical information and an analysis of the patterns over time. For that, you need a dedicated monitoring system.
RavenDB doesn't attempt to build a full-blown monitoring solution in the dashboard, only to show you the most-pertinent information. The expectation is that you'll plug RavenDB into your existing monitoring solutions. Let's now explore what kind of hooks are provided for you to do just that.
Ongoing monitoring
The most obvious monitoring option is to use SNMP.1 To configure SNMP in RavenDB you'll need to set it up in the way shown in Listing 16.1.
Listing 16.1 Setting up SNMP using the settings.json configuration file
{
    "Monitoring.Snmp.Enabled": true,
    "Monitoring.Snmp.Port": 161,
    "Monitoring.Snmp.Community": "password"
}
Once you have the configuration options from Listing 16.1 in the settings.json file, restart the node. You can
now start querying RavenDB's internal state using SNMP. For example, the command in Listing 16.2 fetches the server update from the public RavenDB test instance.
Listing 16.2 Getting the live instance server update via SNMP
$ snmpget -v 2c -c ravendb live-test.ravendb.net 1.3.6.1.4.1.45751.1.1.1.3

iso.3.6.1.4.1.45751.1.1.1.3 = Timeticks: (84790246) 9 days, 19:31:42.46
The key parts of these commands are:
-v 2c- the protocol version (RavenDB uses RFCs 1901-1908)-c ravendb- the community string, which in this case is-c password, etc. (in the case of the public instance, the defaultravendbis used)live-test.ravendb.net- the hostname, which in this case is the live instance (plug your own instance URL here, of course)1.3.6.1.4.1.45751.1.1.1.3- the OID to query, which in this case is the server uptime
The output of the command in Listing 16.2 is the server uptime, fetched via SNMP. We told RavenDB that we wanted this particular value using the OID in the command.
OID stands for Object Identifier, which is a way to globally name a particular value. The
1.3.6.1.4.1.45751 prefix belongs to RavenDB, and anything nested under it denotes a particular value that can be queried. Don't worry, you don't have to memorize all these OIDs. Instead, you can simply
ask RavenDB for a list of any that are supported for a particular instance, by calling the /monitoring/snmp/oids endpoint on your server. For the live test server, that would be http://live-test.ravendb.net/monitoring/snmp/oids.
The /monitoring/snmp/oids endpoint can be very helpful because it also gives you the OID for specific values in specific databases. For
example, the 1.3.6.1.4.1.45751.1.1.5.2.2.2.1 OID can be used to tell us the size (in megabytes) of a particular database.
This can make it very easy to plot all sorts of interesting values over time. You can also use SNMP to monitor
the index rate of a specific index in a specific database. The amount of details and control you have is extensive.
Of course, you won't usually be querying SNMP OIDs using snmpget. You'll instead plug in directly a monitoring solution like Zabbix, Nagios, SCOM, OpenView, etc. The online documentation has a few walkthroughs for setting up common scenarios, but I'll assume you're familiar with your own monitoring systems and skip any further hand-holding at this point.
RavenDB isn't the only source of monitoring data.
RavenDB exposes a lot of information about its internal state to make it easier to figure out what's going on. Yet we don't bother to expose the machine state via SNMP. RavenDB assumes that you can get that information directly from the machine using standard monitoring metrics (the
1.3.6.1.2.1.25.3.3OID to get per-core CPU load, for example).When setting up monitoring, be sure to include metrics for anything that is useful; CPU load, memory, network and I/O are among the most-common values that should be tracked. In most systems, these are part of the standard templates and require very little effort to set up. I mention this explicitly because tracking only the values that RavenDB provides will paint only part of the picture.
Beyond using SNMP, RavenDB also exposes a lot of the state in REST endpoints, outputting JSON that you can use.
These are meant both for humans to look at during troubleshooting and for automated systems to scrape and store over time.
Most monitoring solutions have a way for you to provide a URL and a way to fetch the interesting values from the response.
For example, Zabbix supports JSON Path queries from JSON data sources.
You can get the full list of the debug endpoints from your server's /debug/routes endpoint. (For the live test server
this URL would be http://live-test.ravendb.net/debug/routes.) Just like any
other endpoint in RavenDB, when running in a secure mode, you'll need to provide authentication using a client certificate.
Each monitoring solution has a different way of specifying this authentication, so check your user's manual for more details.
What should be monitored?
Now that we know how to get the values to monitor, the obvious question is: What should be monitored? I'm afraid that this is a hard question to answer, as it depends on your actual usage and needs. CPU load, memory, network and disk I/O are the most obvious things that you want to pay attention to. The numbers of requests and writes are also very interesting in most cases.
Why not just monitor everything?
You can most certainly capture and store all the values that RavenDB and the machines expose. The problem there is that most of this information isn't relevant for most scenarios. So, you might end up with a needle-in-a-haystack situation when you're looking for something specific. The pertinent information would be easily overlooked when drowning in so many other details.
At the very least, you definitely want to monitor values like the number of alerts for each of your databases. But seeing the time since the last query for each index is probably not worth it.
The general recommendation is to start with the basic template (see the online documentation for more on that) and add more details as you see fit. A lot of these details depend on whether you're seeing any signs of trouble and are hoping to head them off early on.
This is a vague advice, I realize. But the problem is that good advice is hard to give when speaking in generalities. One scenario may call for a B2B system with a fairly constant load, so that seeing the CPU percentage go too low or too high would be a a strong indicator of an issue. But for another scenario, such as a user-facing system with hardly any activity at lunchtime, a spike in CPU usage at 9 AM every single workday would be normal.
There is simply no substitution for knowing your environment and what's expected. Once you know that, you can set thresholds for alerting the operations team when the monitored values go out of their expected range. Some monitoring tools can even analyze the data on their own and detect and report when there are irregularities for you.
Performance hints and alerts
RavenDB itself is constantly monitoring its own health. This includes measuring I/O latencies, connectivity to other nodes in the cluster, the amount of memory and disk available, etc. For some of these values, RavenDB will take action on its own. For example, if the memory is low, RavenDB will switch gears and actively try to reduce its memory usage to avoid running out of space completely.
Most of the time, however, there isn't much that RavenDB can do. For example, if the backup folder is out of free space or if RavenDB is experiencing slow I/O, all RavenDB can do is alert you to these troublesome details. Such issues appear as performance hints and alerts, as shown in red in Figure 16.1.
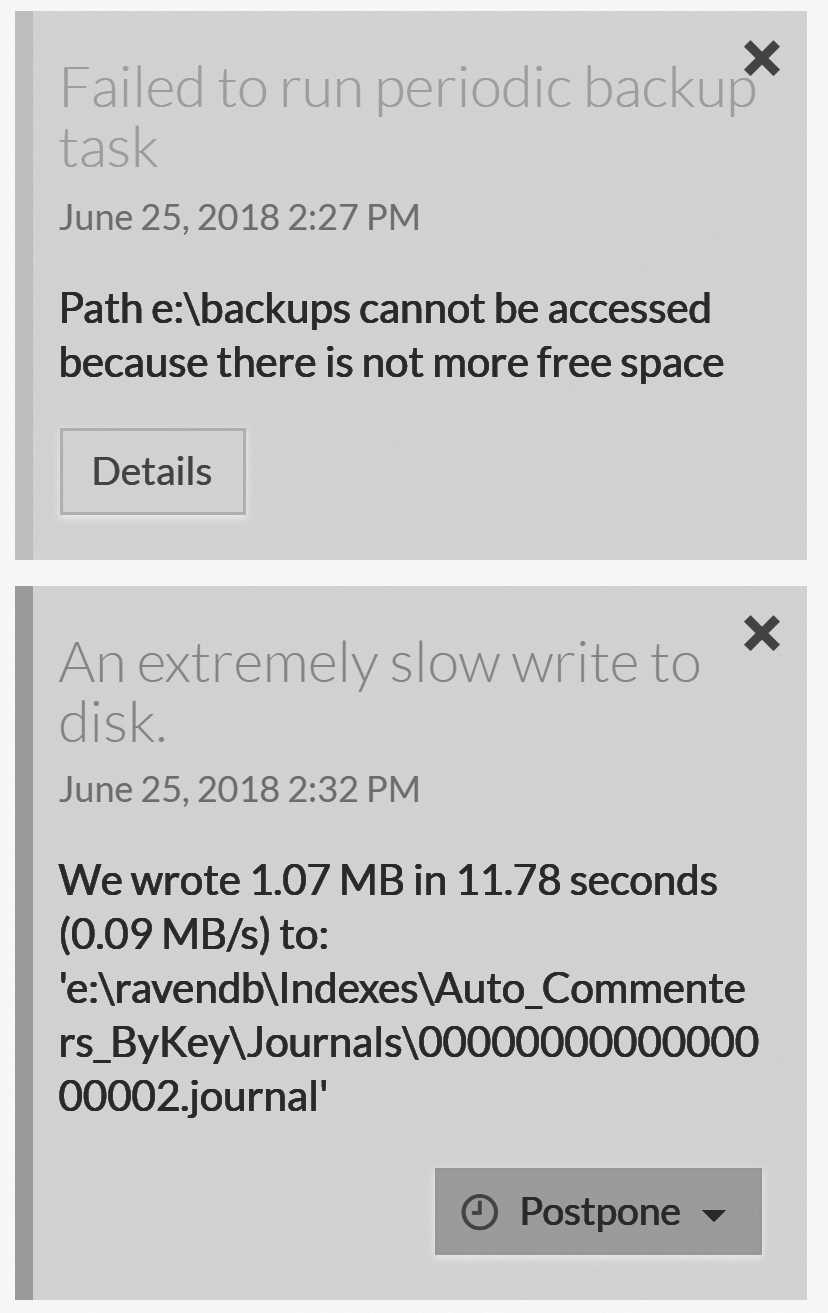
Alerts are issues that RavenDB encounters that require some sort of manual intervention. These may be something simple, such as running out of disk space or network issues with talking to a particular database. Sometimes the errors are transient, which is common in network scenarios. Alerts are also generated for your perusal even if the actual error was already fixed (a connection resumed between the nodes, for example) because investigating what happened after the fact can still be useful.
Alerts are node-local.
An alert isn't a cluster-wide notification. Indeed, in many cases, you'll be alerted that a node is unable to talk to the rest of the cluster. As such, you need to monitor each node in the cluster and check its state whenever an alert appears.
Performance hints, on the other hand, are different (see the blue in Figure 16.1). While they don't denote errors, they do very likely warrant your attention. RavenDB generates such hints for various reasons, such as the slow I/O example in Figure 16.1. Other reasons include queries that return very large numbers of results without using streaming, slow requests, high fanout during indexing and a few other common issues.
These issues aren't typically too severe, but they're still better to address early on. Hints are generated whenever RavenDB detects a use pattern that is known to be problematic. For example, if your queries have a very large page size or your documents are unusually large, then RavenDB identifies a potential for issues and is proactive in bringing these to your attention.
In general, alerts are designed as an acknowledgement that no one reads the logs until it's too late. So, instead of hiding errors in a text file that no one reads, RavenDB ensures that your operations team knows about any big stuff as they need to.
The debug log
Alerts are high-level items that need operator attention. By design, very few things rise to the level of alerts, to avoid spamming your operations team with too many cries for attention. That's where the debug log comes in.
RavenDB has just two log levels: Operations and Information. By default, RavenDB will log only messages
with the Operations label. Operational log messages are things that the operations team needs to pay attention to
or be aware of, such as updating certificates, a failure to process commands, background tasks errors, etc.
At the Operations level, the log output is meant to be readable and fairly shallow. You aren't informed about anything that
goes on inside RavenDB, only things that matter to the operations team. These are mostly errors and issues, even if they were transient or already worked around by RavenDB.
The audit log
In addition to the
Operationslevel, RavenDB also supports an explicit audit mode, where RavenDB records all database connections, their sources, the certificates used and their level of access granted.Certain special actions, such as the creation of a database or index, are also written to the audit log. To enable the audit log, you can set a path to
Security.AuditLog.FolderPath. For more details, see Chapter 13.
The Information level, on the other hand, is much more detailed and will include anything that
goes in the database. This level can be helpful when tracking down a specific issue, but it generally results in a lot
of data. On a busy server, you can easily see a log file roll over after reaching its 256 MB limit in five to ten minutes.
By default, RavenDB retains log files for 72 hours. After that, these files are deleted. In many cases, you'll have a logs agent that monitors the directory and sends the logs to a central location, which means you can delete the logs file as soon as RavenDB starts a new one.
The logs location is controlled by the Logs.Path configuration option, and the general recommendation is to have RavenDB
write the logs to a separate hard disk. This is to avoid the case of setting the Logs.Mode to the
Information level and having the logs fill up the RavenDB data disk completely. If you do change the logs path or mode, a server restart is required.
But these logs aren't the only ways to get information from RavenDB.
Finding out what your server is doing
If you run into issues with RavenDB, it might be too late to set up logging and monitoring. Recognizing this reality, RavenDB is designed to have a lot of knobs to tweak and places to peek into under the hood on a regular basis. But this does not mean you can skip setting up a proper monitoring regime. The techniques outlined in this section are nonetheless very useful when trying to understand the behavior of RavenDB.
In many cases, these techniques can help you pinpoint what's going on very quickly. Monitoring, on the other hand, gives you insight into the behavior of the system over time and alerts you if something is out of whack. Any production cluster is expected to have a proper monitoring strategy.
The RavenDB Studio does provide explicit support to help you figure out what's going on. The first place to look is
inside Manage Server and the Debug section, shown in Figure 16.2.
Debug section is your first stop to figure out what's going on inside.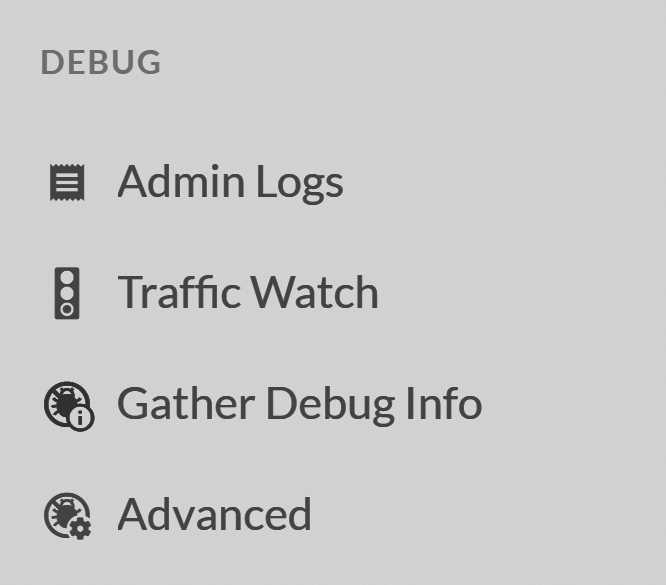
These options are only available to the operations team (requiring Operator or Cluster Admin privileges).
This is because they contain data for the entire server, not for a particular database. A standard user will not be
able to use these features.
Let's explore each one of these options in turn.
The admin logs view
The easiest way to figure out what's going on inside RavenDB is to use the Admin Logs feature. This lets you
hook into the logs stream generated by RavenDB and view it in a browser — a very convient option, because it doesn't require you to do anything to the server.
Even if the server is configured to not log anything, going to the Admin Logs page will start streaming the log
entries to you at the Information level. This means that you can enable the logs and watch them only during interesting
periods, instead of having them on all the time (or having to restart the server to change the logs mode).
rvn logstreamFrom the command line, if you're running on the same machine as RavenDB, you can use the
rvn logstreamcommand to have the same effect of seeing the logs stream on the console, but only for the pre-configured logging. Thervn admin-channelcommand has an option to enable logging on a live server on a temporary basis.
Errors will be highlighted in red, but note that many of them are actually expected and are handled by RavenDB. So, don't let seeing some errors here alarm you.
Note that debug level logging can cause the server to have to do a lot more work. While convenient, this feature comes with a potential performance penalty. In most cases, that isn't something to worry about. RavenDB uses a purpose built logging system that was design for low overhead and high throughput. But if your system is on the verge of resource exhaustion, enabling the debug logs can cause noticeable effect on the system.
The traffic-watch view
Looking at the logs can be fairly tedious, given how much information is being generated. In some cases, it's easier to figure out what's going on by just looking at the requests being made. RavenDB offers a dedicated view for that, as shown in Figure 16.3.
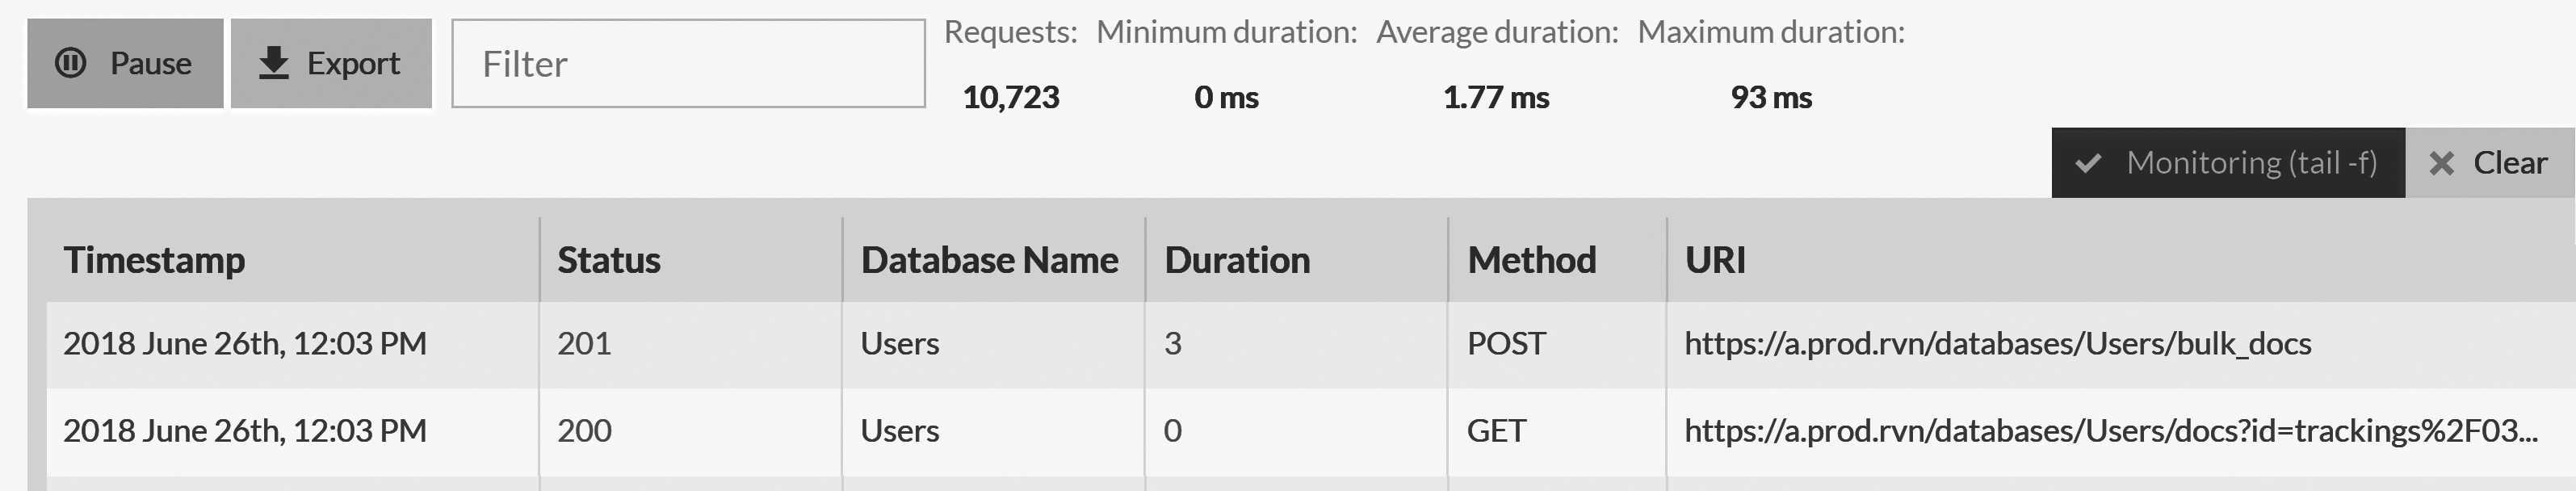
In Figure 16.3 you can see each individual request, how much time it took and some statistics about all the requests captured during a specific session (number, min., avg., max. duration). This information can be very helpful if you want to figure out why something is slow or resulting in an error. You can also export the traffic capture for later analysis.
The debug info package
By far, the most valuable tool for inspecting the state of RavenDB is the Gather Debug Info page. You can see how this
looks in Figure 16.4.
Debug Info package gives us access to all the RavenDB debug endpoints.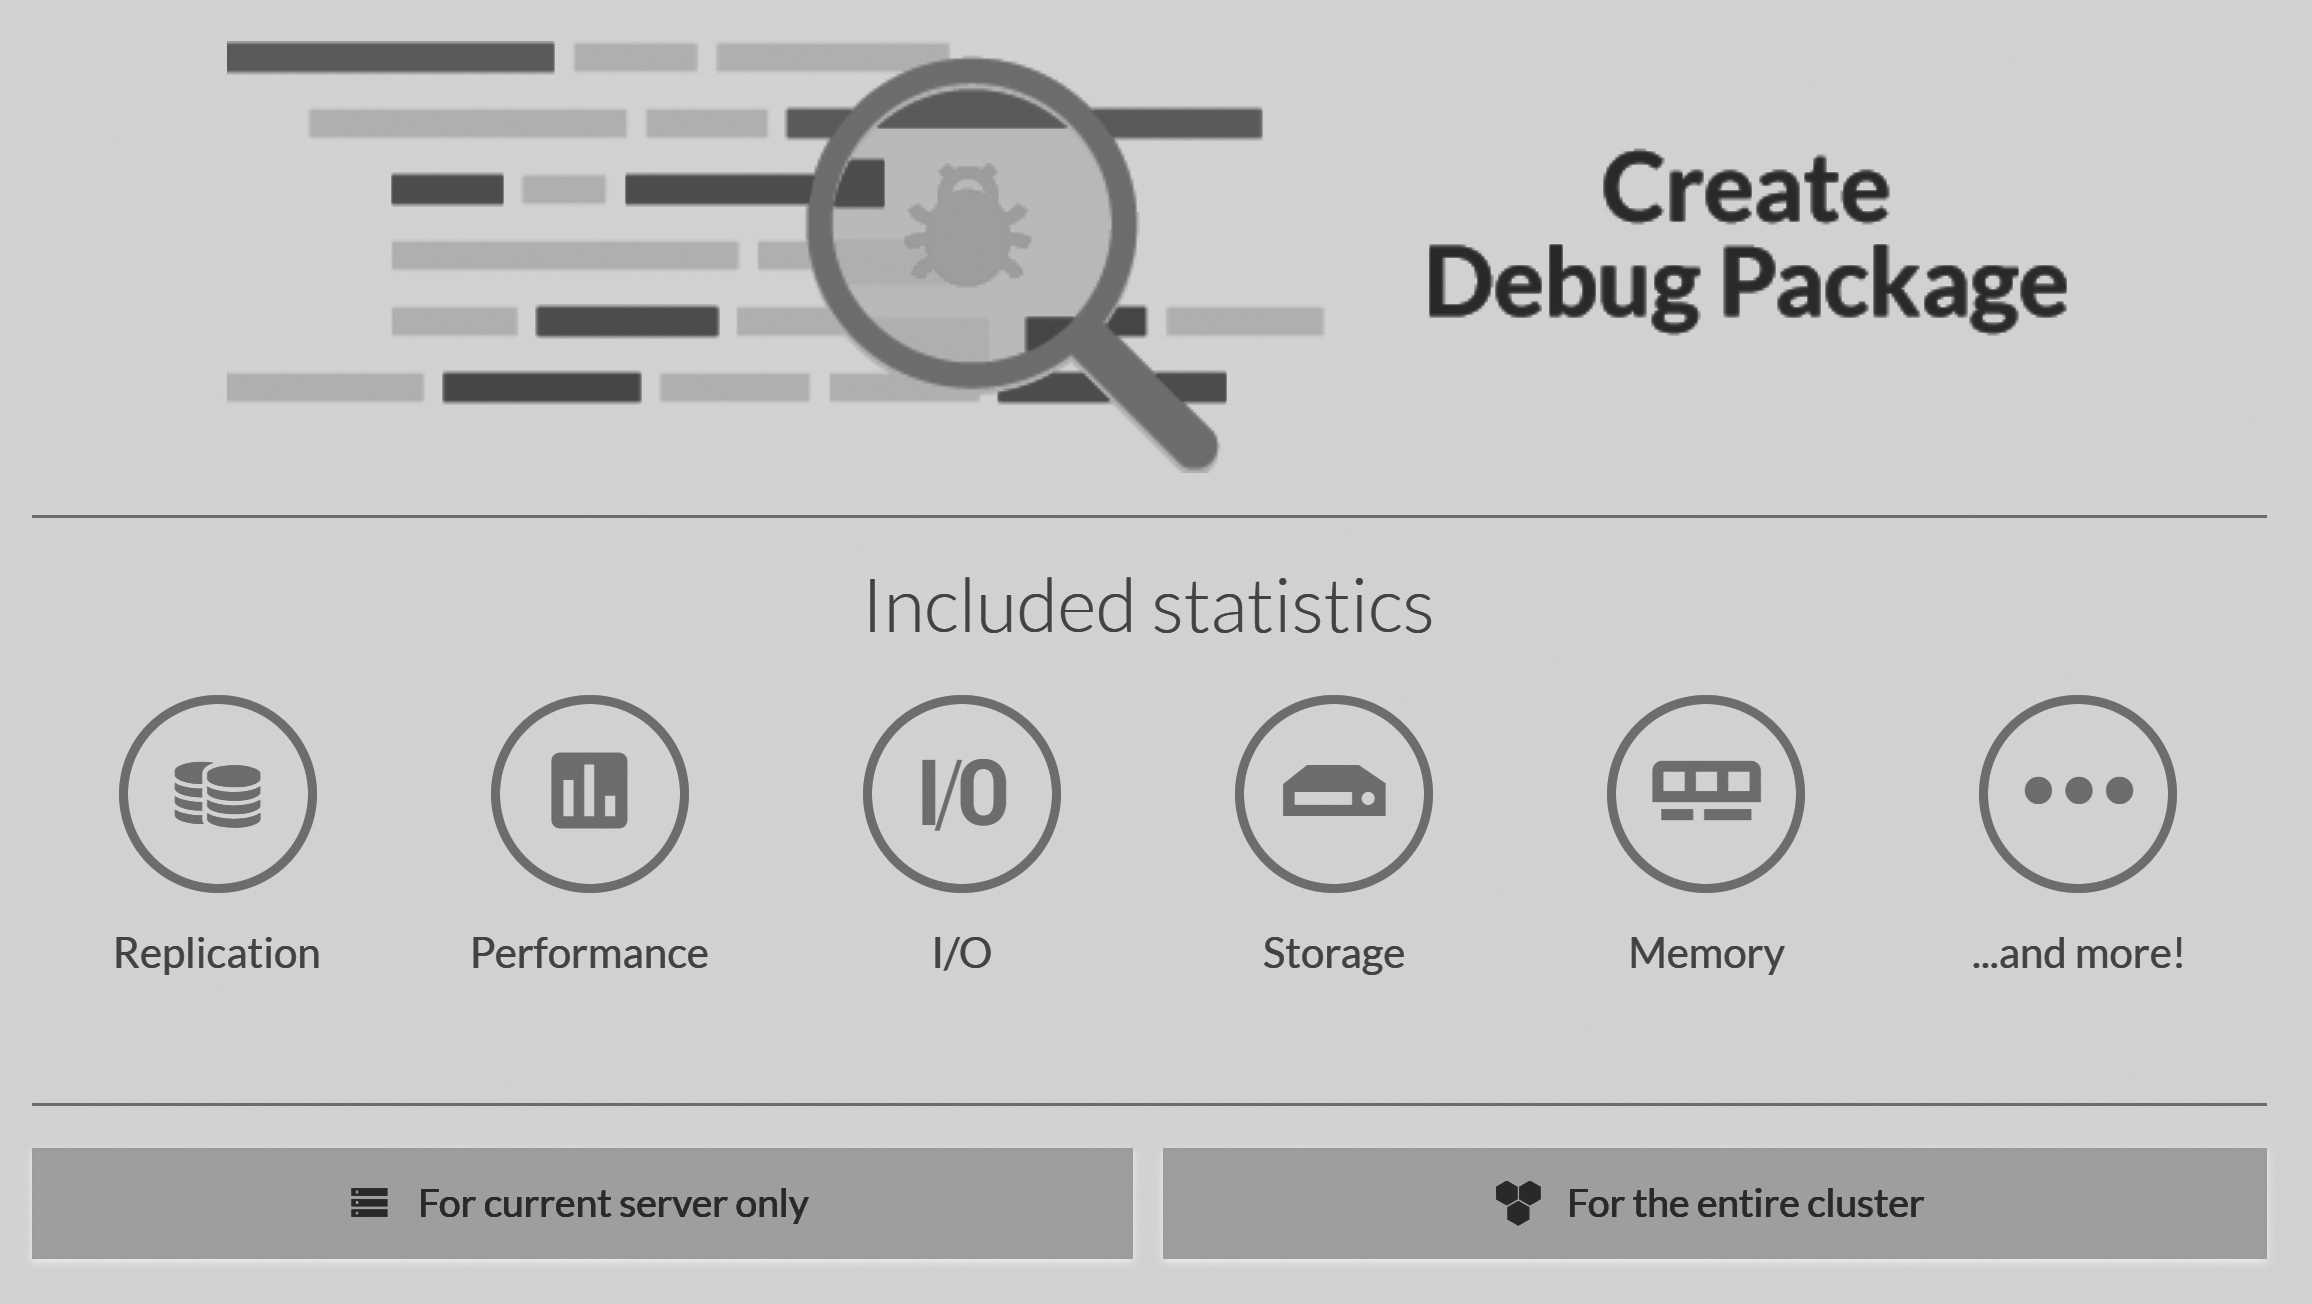
What this page does is give us the ability to generate — at the click of a single button — a snapshot of the current
state of the RavenDB instance or even the whole cluster. The result is a single zip file that you can send along
with your support ticket or analyze offline at a later date.
I mentioned a few times before that RavenDB goes to great lengths to externalize its state. Even with this chapter — dedicated entirely to helping you figure out what RavenDB is doing — I won't have enough time or space to go over all the details that are available. Some of them are extremely useful for a single, specific case. But usually you don't need to go over each and every one of them.
The ability to so easily capture the entire state at once means that if you are in a bad state, you can quickly see the current status of the system and immediately take potentially invasive action to fix it. The classic example is rebooting the system, which will "fix" many issues. The problem is that if you do so, you'll also typically lose crucial information about what went wrong and how to prevent it in the future.
The Debug Info package allows you to retain all of that knowledge. It's also very useful if you need to contact
the RavenDB support team, since it saves a lot of back and forth.
Advanced details
The last item in Figure 16.2 is the Advanced option. This is where RavenDB puts details that can be very interesting but
aren't usually needed. Among them, we have two views, as shown in Figure 16.5.
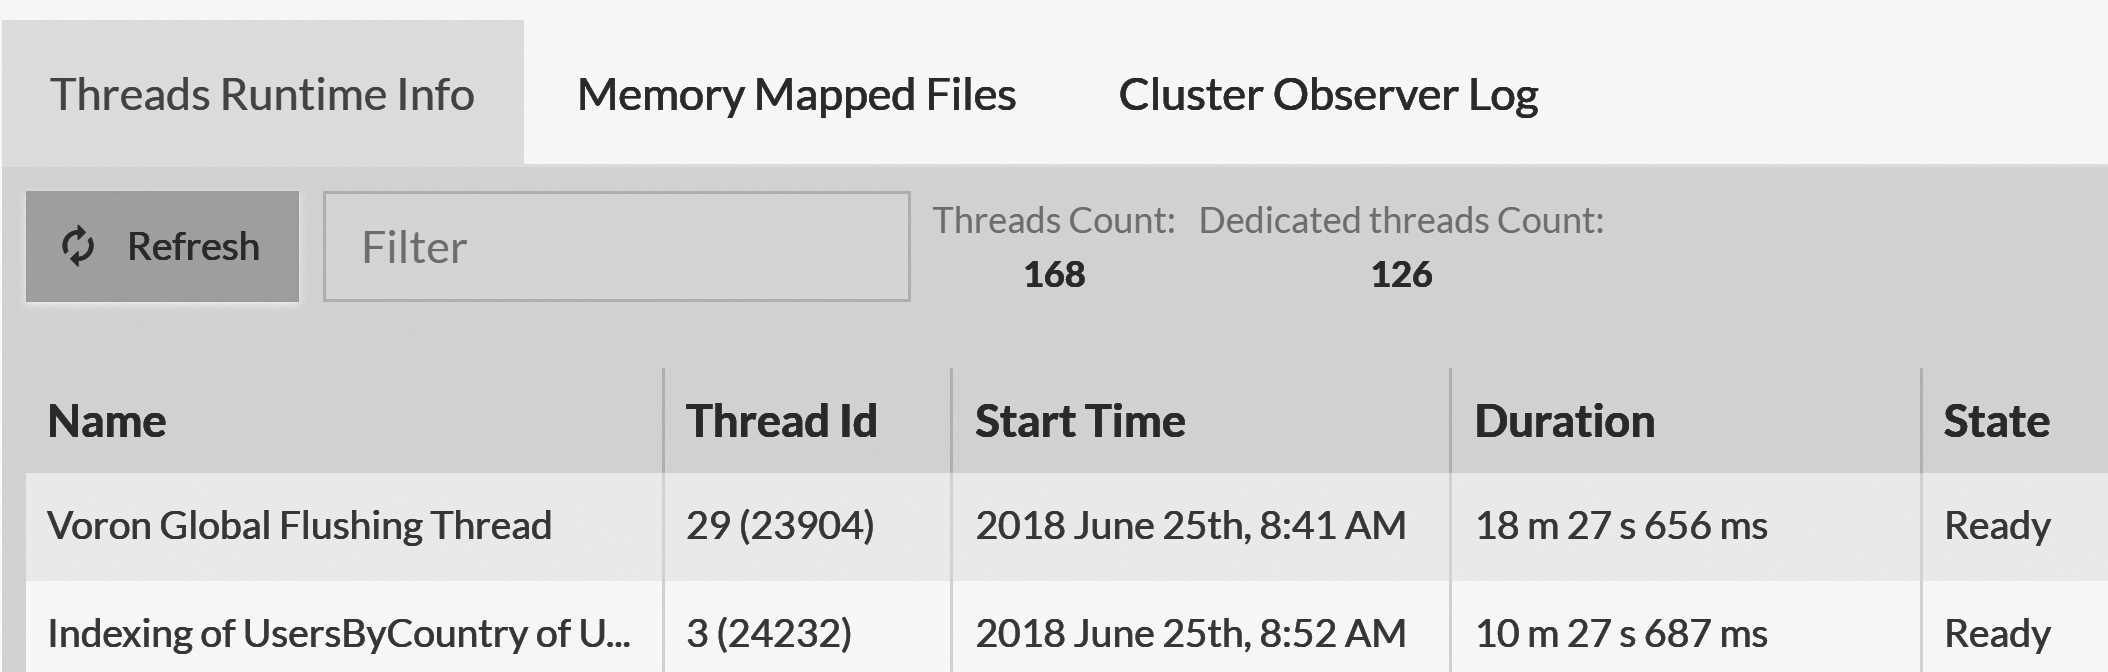
Figure 16.5 shows the details on the threads inside RavenDB. This information can tell you what exactly is costing you CPU time.
The list is sorted by usage order, so threads that burn through a lot of CPU will show up first. In the case of Figure 16.5, you
can see that the most costly thread is the Voron Global Flushing Thread (we'll discuss I/O, which is what this
thread is doing, later in this chapter), followed by an indexing thread.
RavenDB typically names threads intuitively — according to what they do — which makes it easier for the operations team to quickly figure out what's costing you and to take action.
Another interesting peek into the inside of RavenDB is offered by the Cluster Observer Log view. In Chapter 7 we discussed how the RavenDB cluster observer assigns work and even automatically moves databases between nodes. Figure 16.6 shows the logs of such a decision, allowing you to examine and understand them.
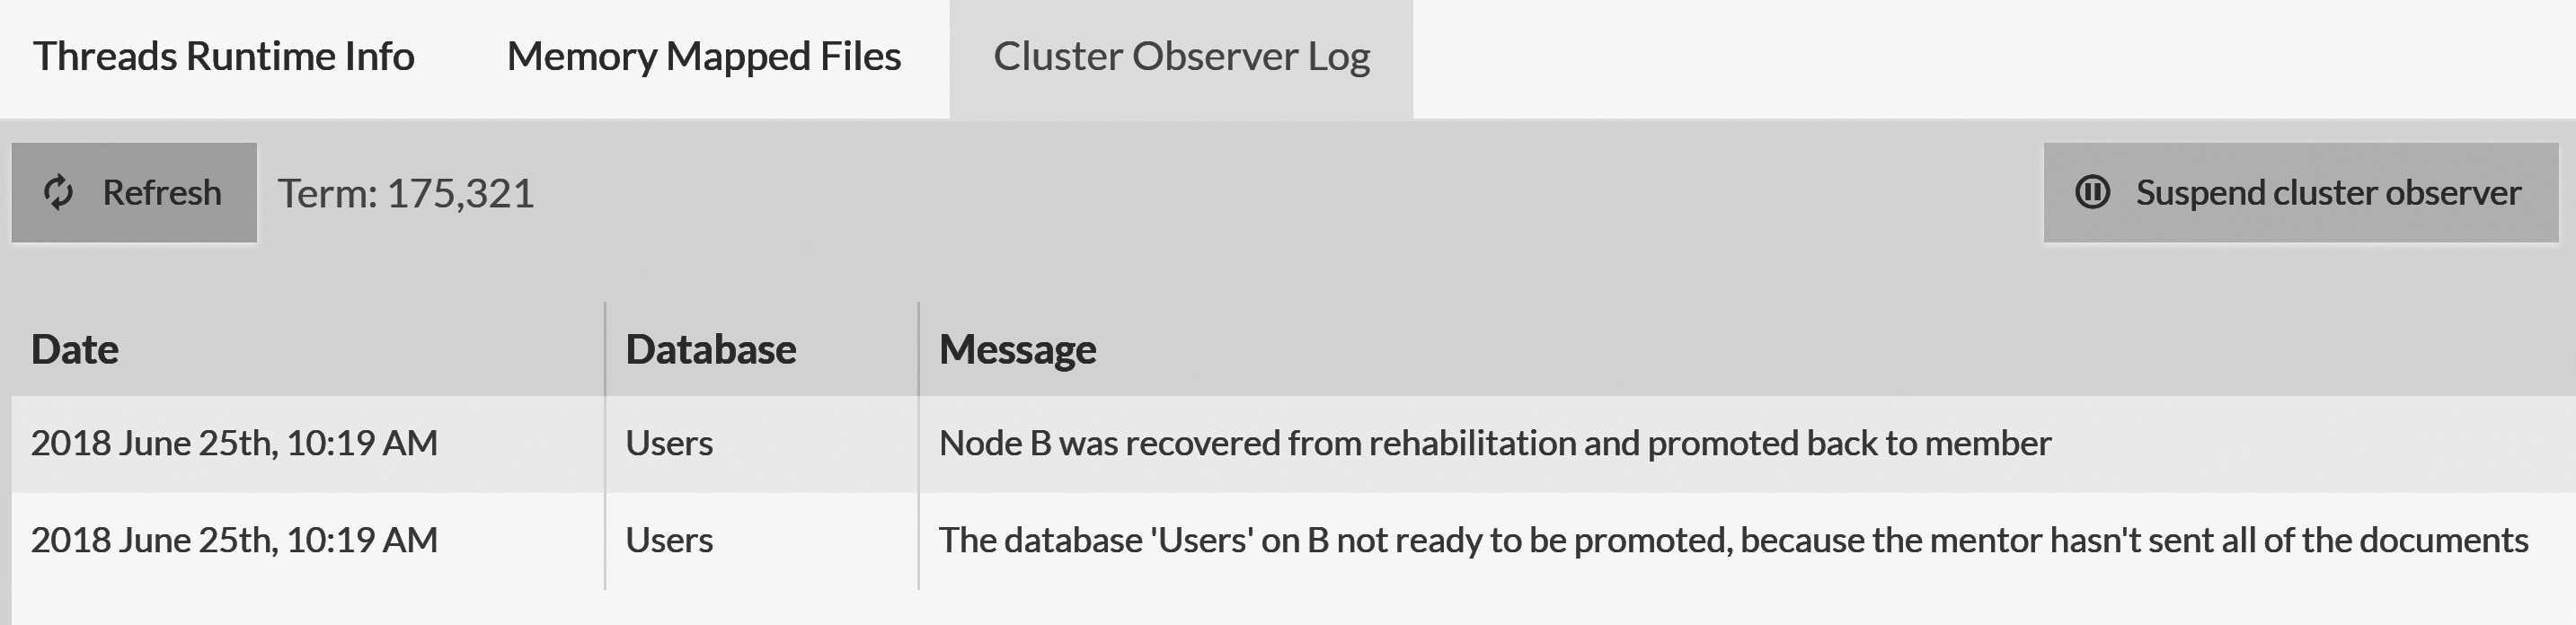
The logs in Figure 16.6 show that Node B was down, as well as at what point the cluster detected that this node's databases caught up with the rest of the nodes in the database group. This allowed the cluster to move Node B from a rehab state to a normal member state.
Operational stability
Two of the worst things a piece of software can do to an operations team is surprise and mystify them. Surprises are almost never a good idea in production. And a good mystery is wonderful when it comes in book form, but not when you're trying to figure out what blew out in production.
The cluster observer routinely monitors the health of the entire cluster, making decisions about where traffic should go and which nodes are reliable. By default, it will only take action if a node is down for a long time (15 minutes or more).
This means that it won't start taking action before you can react. You can also ask the cluster observer to suspend any actions for a while, if, for example, you know that you will be doing maintenance that would normally trigger it to act. This is done using the
Suspend cluster observerbutton shown in Figure 16.6.
This view can be very useful for understanding how the system got into its current state and what has led the cluster observer to make the decisions it did. This information is also logged, of course, but is usually much easier to see in a condensed form here than by searching through the log files.
I/O operations in RavenDB
As a critical part of its database, I/O matters to RavenDB. In particular, I/O performance matters. A lot of problems in production can be tied directly to issues with I/O. And these issues typically come with one (or both) of the following:
- insufficient depth - when the I/O system can't handle the amount of data (read/write) fast enough
- insufficient width - when the I/O system can't handle the number of concurrent read/write requests fast enough
Both these issues will end up looking like slow I/O. But their root causes are different. In the case of insufficient depth, we have an I/O system getting requests that are too big for it. A good example is when you're trying to make a large write (greater than the buffer size, typically) and seeing very high latency.
Imagine I/O bandwidth as a shipping channel.
I use the terms depth and width here because of the following metaphor. Imagine a water channel that has ships going through it. If you have a ship that's heavily loaded, it would be sitting deep in the water. If the channel doesn't have enough depth, then this ship will repeatedly hit the bottom. Bringing this idea back to our case, a "heavy" I/O request will usually still work, but very slowly.
As for width, imagine a water channel with a lot of canoes going through it. The wider the channel, the greater number of canoes that can go through it at the same time. But if the channel has insufficient width, you're sure to see a traffic jam. The same with I/O: If you have a lot of requests (even if they are individually very small) the I/O system might struggle to serve them all.
If you're running on an HDD and making a lot of random reads, this task requires seeking, which is slow. For a single continuous write, the HDD is wonderful (high depth). But for concurrent work, not so much (insufficient width).
If you ever wonder how to better spend your hardware budget, get better I/O — it will almost always be a good idea. Given the way RavenDB handles memory, if you have a fast-enough disk (NVMe comes to mind) you can even get a machine with less RAM in favor of getting higher end drives and faster I/O. For some scenarios, getting the memory-mapped data from NVMe disk can usually happen quickly enough that it doesn't have to be in main memory for acceptable performance.
What should you look out for?
Watch the disk queue length. If this length grows, it's usually a sign that requests are waiting on the I/O system. If this length is high for long period of time, then there's a starvation of your I/O and your database is likely suffering.
High disk queue length means that some form of action is required (upgrading hardware, increasing IOPS, changing the load pattern, etc).
RavenDB will alert you if it detects slow I/O for writes (as you already saw in Figure 16.1). But for more detailed
I/O monitoring, you'll need to look in a few additional places. RavenDB makes this easy by gathering all I/O statistics on
writes in one place. In the RavenDB Studio, go to your database, then Stats, then IO Stats.
You can see how this looks in Figure 16.7.
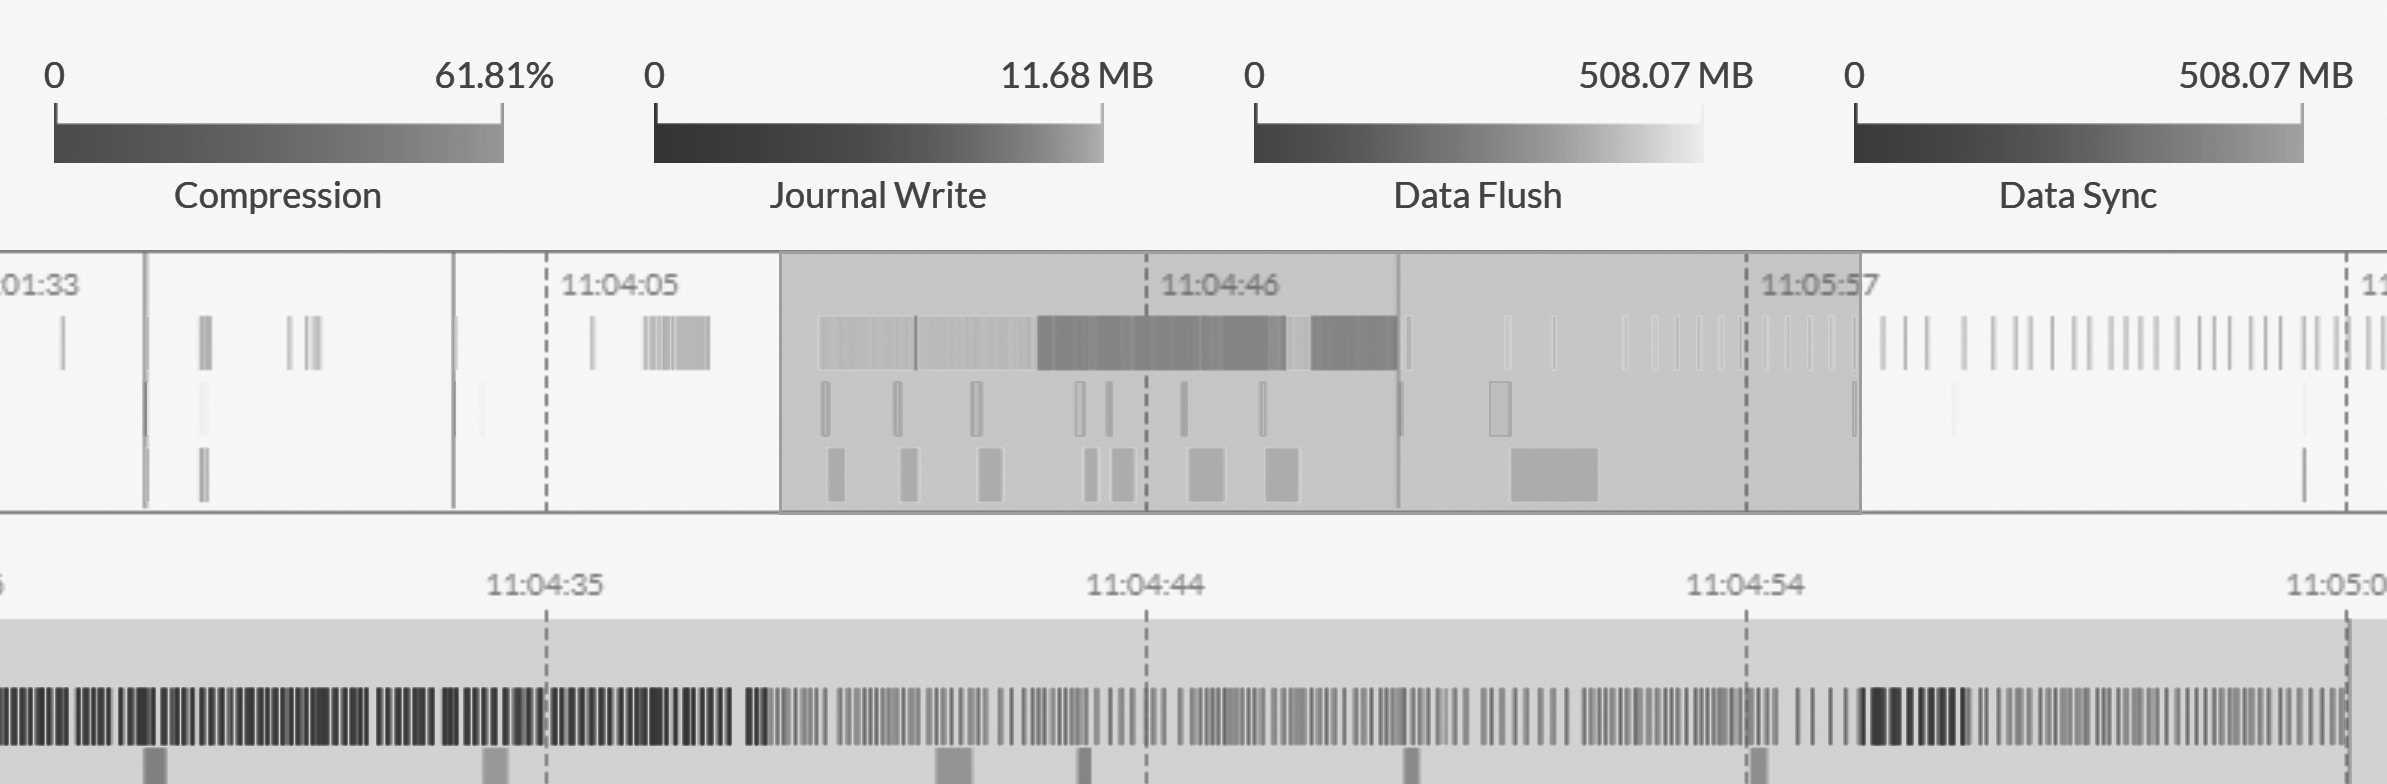
There's an abundance of details in Figure 16.7, and it probably won't make sense in isolation. In the Studio, however, you can zoom in and out to inspect every detail in the performance graph. Doing so can give you tremendous insight into any specific operation that RavenDB made.
The green bar at the bottom is the most important piece of data. There, you can see the costs of writes to the journal file over time. Since a transaction can't be completed before writing its changes to the journal file, that's the critical hot path for any performance issues with slow writes. Any delay in completing the journal write will be translated to delays in returning write results to the users.
The size of each write indicates how long it took, and the color tells you how big it was. The darker the value, the bigger the write. In general, you want to see a healthy situation, involving mostly small (and therefore shown using light colors) and thin writes. Having a few wider and darker spots is also fine (although writing more may take longer, obviously), but if you see wider areas that are bright (small writes that took a long time), then these are usually signs that the I/O system is saturated.
In such cases, you want to turn to the operating system's own tools to figure out what's going on. Some ideas about what you should be looking for and how to retrieve them are shown in Table 16.1.
| Windows | Linux | |
|---|---|---|
| Tool | perfmon |
iostat |
| Counters | Disk Reads/sec | r/s |
| Disk Writes/sec | w/s |
|
| Avg. Disk Queue Length | avgqusz |
|
| Avg. Disk sec/Transfer | await |
Table: I/O monitoring tools and what metrics to look at
Table 16.1 is a good starting place to investigate why your system is showing slow I/O symptoms. You can also use the Resource
Monitor tool on Windows and iotop / sysdig on Linux to figure out what files exactly are taking up all your I/O.
Do you have enough IOPS?
When running on the cloud, a surprisingly common mistake is to forget to reserve enough IOPS for your data disks. With many cloud providers, you have some sort of burst capability, after which you'll be throttled. In that case, you'll see a good performance initially (until the burst window is closed) — and then a sharp drop. This is the very first thing to check for I/O issues when running on a cloud.
When running on your own hardware, talk to the storage team to make sure that the database server has a high enough quality of service (QoS) rating to support the workload you have on it. I've seen cases where RavenDB was put on a powerful server, backed by a SAN full of speedy drives, and the QoS setting it had restricted the database to about 5% of the available resources.
In this section so far, we looked at how to gather information about what's going on — whatever it is — via RavenDB and
the I/O Stats graphs or through the operating system tools. Yet we're still missing how to make this information
actionable. To know what to do when you have I/O issues, we need to first understand how RavenDB uses I/O.
RavenDB I/O behavior
The graph in Figure 16.7 shows how RavenDB keeps track of its writes. In general, RavenDB writes mostly to documents and indexes. Each write goes first to the journal (the green bar in Figure 16.7) and then is flushed to the data file (blue bar). Every now and then RavenDB will sync the data to the disk (using fsync) to allow for reusing the journal files.
Flushing data and syncing to disk
RavenDB uses the term
data flushto describe the process of copying modified transaction data to the memory-mapped data file. This operation is typically very fast, since it works by copying from memory to memory, involving no disk I/O. Periodically, RavenDB will ensure that the data written to the data file actually resides on disk by callingfsync. This is called adata sync, and it's typically much more costly as an operation.
It is important to understand that within a given storage environment (the documents store for a database, or each individual index), there can only be a single outstanding write, a single data flush and a single file sync. However, writing to the disk, flushing the data and syncing to disk can all run at the same time.
Each index is also a full-blown storage environment, meaning that each will have its own cycle of journal writes, data
flushes and fsync calls. Each index also runs completely independently from other indexes and the documents store — when
you have multiple databases inside the same server, each database and index will also operate independently of and concurrently with the others.
What about reads?
So far we've covered a lot of details about how RavenDB writes data. But what about reads? How are those handled?
All I/O operations in RavenDB use memory-mapped I/O. In other words, we let the operating system buffer the cache, to manage what lives in memory and when to read from the disk. In most cases, the operating system will know how to select an effective working set that will minimize the amount of I/O required for RavenDB.
If that isn't the case — for example, if you don't have enough memory for your workload — you'll start seeing a high number of page faults. In particular, pay attention to hard page faults. A few of these are to be expected, but seeing a spike in the hard page faults per second counter indicates a possible issue.
If you're using a faster disk, you might not care about this issue. NVMe reads, for example, are fast enough that in some cases they replace the main memory. Or, you might be reading cold data because a new index was created that needs to go over existing documents. But in most cases, seeing high hard page faults per second indicates an issue and requires investigation.
By default, RavenDB limits the number of concurrent syncs and flushes that are performed on a specific device, to avoid
overwhelming the disk with too many writes at the same time. This is controlled by the Storage.MaxConcurrentFlushes and
Storage.NumberOfConcurrentSyncsPerPhysicalDrive options.
For best performance, we recommend having each database use its own device. That way, they don't have to fight for the same hardware resources. For the same reason, you can also dedicate specific drives for indexes or journals by using symbolic links and junction points, as discussed in the previous chapter.
How the data is laid out on disk
After looking at how RavenDB uses I/O, the next obvious step is to look at how the data is actually stored on disk. Table 16.2 lists the files that are stored and how RavenDB uses each of them.
| Path | Purpose |
|---|---|
| Raven.voron | The main data file for a database |
| headers.* | Snapshot of the global state of the database |
| Scratch/ | Directory to hold temporary data while the database is opened, such as compression buffers, uncommitted data, etc. |
| Journal/ | Holds the write-ahead log (transaction journals) that are key to ensuring ACID behavior |
| Indexes/ | Recursively holds the same structure (Raven.voron, headers.one, Scratch, Journal) for each of the indexes. |
Table: File structure of a RavenDB database on disk
You can go to the RavenDB database directory to look at these files, but they won't really mean much. They hold binary data and are opaque to the user.
Exclude the RavenDB directories from indexing services and from antivirus scans.
If your machines have any kind of antivirus or file indexing services, you should exclude the RavenDB directories from them. That's because these services often add significant latency to the I/O.
It's also common for these services to lock files, cause I/O failures and, in general, mess around in what RavenDB considers its own backyard. Please keep anything (whether a noisy antivirus program or a curious user) from dealing with the RavenDB directory directly.
You can't really learn anything about the file structure from the file system. But you can learn quite a bit from
asking RavenDB what's going on directly. In the RavenDB Studio, go to your database, then to Stats, then
Storage Report. Figure 16.8 shows what this storage breakdown looks like for the blog database.
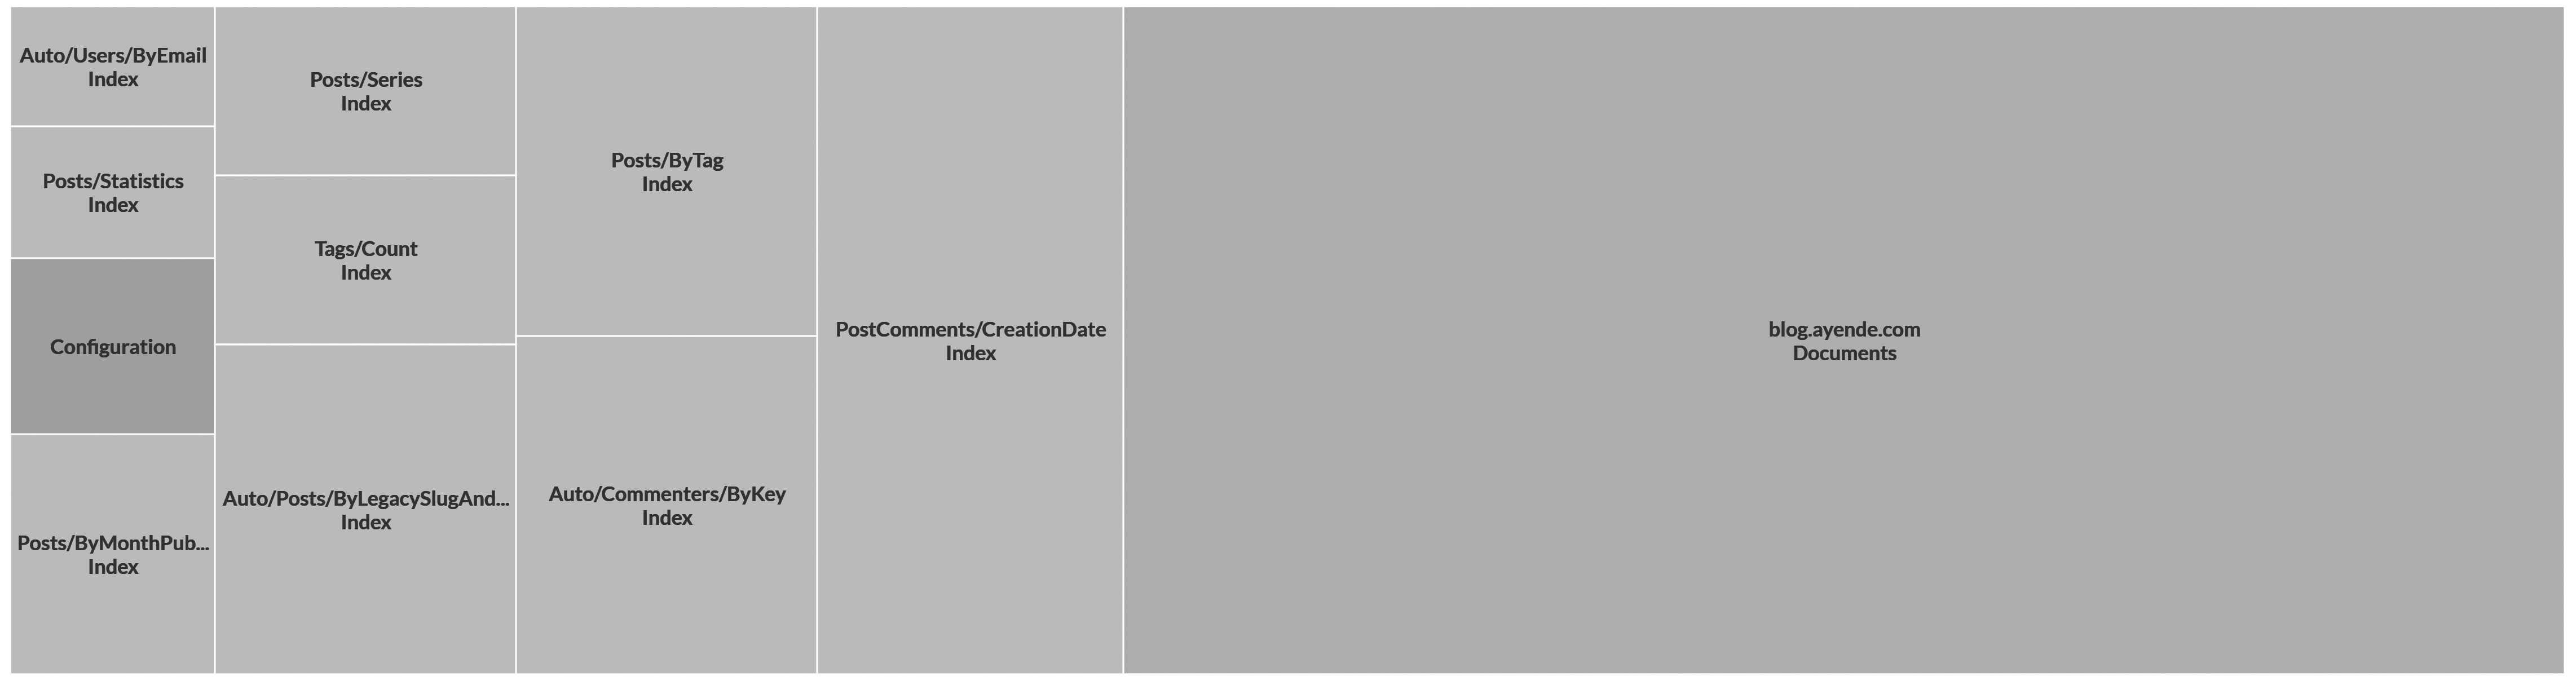
The tree map in Figure 16.8 should help you figure out at a glance what's taking up space in your database. Below the tree map, you'll see a table similar to our Table 16.3.
| Type | Name | Size (SUM 567.62 MB) | % Total |
|---|---|---|---|
| Documents | blog.ayende.com | 320 MB | 56.38% |
| Index | PostComments/CreationDate | 68 MB | 11.98% |
| Index | Auto/Commenters/ByKey | 34 MB | 5.99% |
| Index | Posts/ByTag | 33 MB | 5.81% |
Table: Detailed breakdown of disk size for each item inside a RavenDB database
You might notice that the numbers here are nice and round. That's quite intentional. An index in RavenDB reserves a minimum of 16 MB on the disk. RavenDB also uses a pre-allocation pattern when requesting disk space from the operating system. What does that mean, you ask?
Asking the operating system for more disk space in small increments will result in major fragmentation of your files. Instead, RavenDB asks for a file size increase upfront — starting with doubling the size of the data file on disk every time more space is needed, until 1 GB is reached. After that, the data file grows by 1 GB at a time. This pattern gives the operating system the best chance for allocating continuous disk space for the file (and it reduces metadata I/O overhead in most cases).
You can see how the space is used in a particular item by clicking on it in the Studio, where the breakdown is shown between journals and data for that storage environment. Journals are used whenever a transaction is committed. These files are where RavenDB writes all the changes that happen in a transaction, ensuring that the data is stored in a persistent way and that the hot path of I/O is sequential writes, which is the fastest option.
Journal files are also pre-allocated in terms of space (starting at 64 KB and doubling in size to a max of 256 MB2). Whenever RavenDB is finished using a particular journal file, it will not delete it, but instead reuse it, as needed. This saves the amount of on-disk space allocated to the journals. RavenDB does rename the files to maintain consistent numbering, but the reuse of journals makes sure that the file system allocation is otherwise unchanged.
Going back to the tree map, you can click on the Datafile entry to see the breakdown inside the actual database. Table 16.4 shows what this looks like for the blog database.
| Type | Name | Size (SUM 256 MB) | % Total |
|---|---|---|---|
| Tables | Tables | 156.22 MB | 61.03% |
| Free | Free | 93.70 MB | 36.60% |
| Trees | Trees | 2.28 MB | 0.89% |
| Reserved | Pre-allocated Buffers | 8 KB (out of 6.00 MB) | 0.00% |
Table: Space usage breakdown for a 256 MB database hosting a blog
The information about space in this table is interesting. It's divided into tables, trees, reserved and free. Let's talk about what each of these mean.
A table in this context is not a relational table, but rather an internal structure inside the low-level Voron
storage engine. This is how RavenDB stores data internally. You can click Tables to see more about how much space
is used by each one, as shown in Table 16.5.
| Type | Name | Entries | Size (SUM 156.22 MB) | % Total |
|---|---|---|---|---|
| Table | Collection.Documents.postcomments | 6,604 | 50.65 MB | 32.42% |
| Table | Collection.Documents.posts | 6,589 | 40.21 MB | 25.74% |
| Table | Collection.Documents.commenters | 10,714 | 8.18 MB | 5.24% |
| Table | Collection.Revisions.posts | 363 | 4.18 MB | 2.68% |
| Table | Collection.Revisions.postcomments | 369 | 3.50 MB | 2.24% |
| Table | AttachmentsMetadata | 0 | 2.25 MB | 1.45% |
| Table | Collections | 9 | 2.25 MB | 1.45% |
| Table | Collection.Tombstones.postcomments | 0 | 2.13 MB | 1.37% |
| Table | Collection.Tombstones.posts | 0 | 2.13 MB | 1.37% |
| Table | Attachments.Tombstones | 0 | 2.13 MB | 1.37% |
Table: Space breakdown of the storage tables inside the blog database
As you can see, a storage table is part of how RavenDB implements collections (for example, the posts collection
is using Collection.Documents.posts, Collection.Tombstones.posts and Collection.Revisions.posts). There are also other
tables, such as Collections and AttachmentMetadata, that are used inside RavenDB to implement its functionality. In
general, you won't need to worry about how this is structured. Usually you'll look at this view only to figure out why you might be
using this much disk space.
The Trees section is Table 16.4 is the amount of space used by internal storage indexes. Clicking on Trees shows you more details, but these details tend not to be interesting to operations people, since the indexes are only a small fraction of the data size and thus rarely matter.
The Reserved section is reserved by RavenDB to ensure a high locality of reference internally — an implementation
detail that's used for optimizing access patterns. This section will never be very big, and you can safely ignore it.
What's left in Table 16.4 is free space. And that takes a whopping 36.6% of the data. In this case, RavenDB is pre-allocating
data from the file system. But the section can also refer to free space that RavenDB reclaims once data is deleted.
In general, you don't need to concern yourself with the actual management of the free space inside RavenDB. This process is handled completely internally, and deleted data will free space up for RavenDB to reuse as needed. This means that deleting a lot of documents and then inserting them again will result in disk space reuse.
However, it's important to note that RavenDB does not release free space back to the operating system itself. In other words, if you delete all the data inside a very large database, you won't get any on-disk space back. RavenDB will simply reuse this space as needed.
If you do want RavenDB to give up this space, you'll need to take actually manually by compacting the database.
Database compaction
You can ask RavenDB to compact the database to its smallest possible size by using the Compact database option on the database page (see Figure 16.9).
Databases view.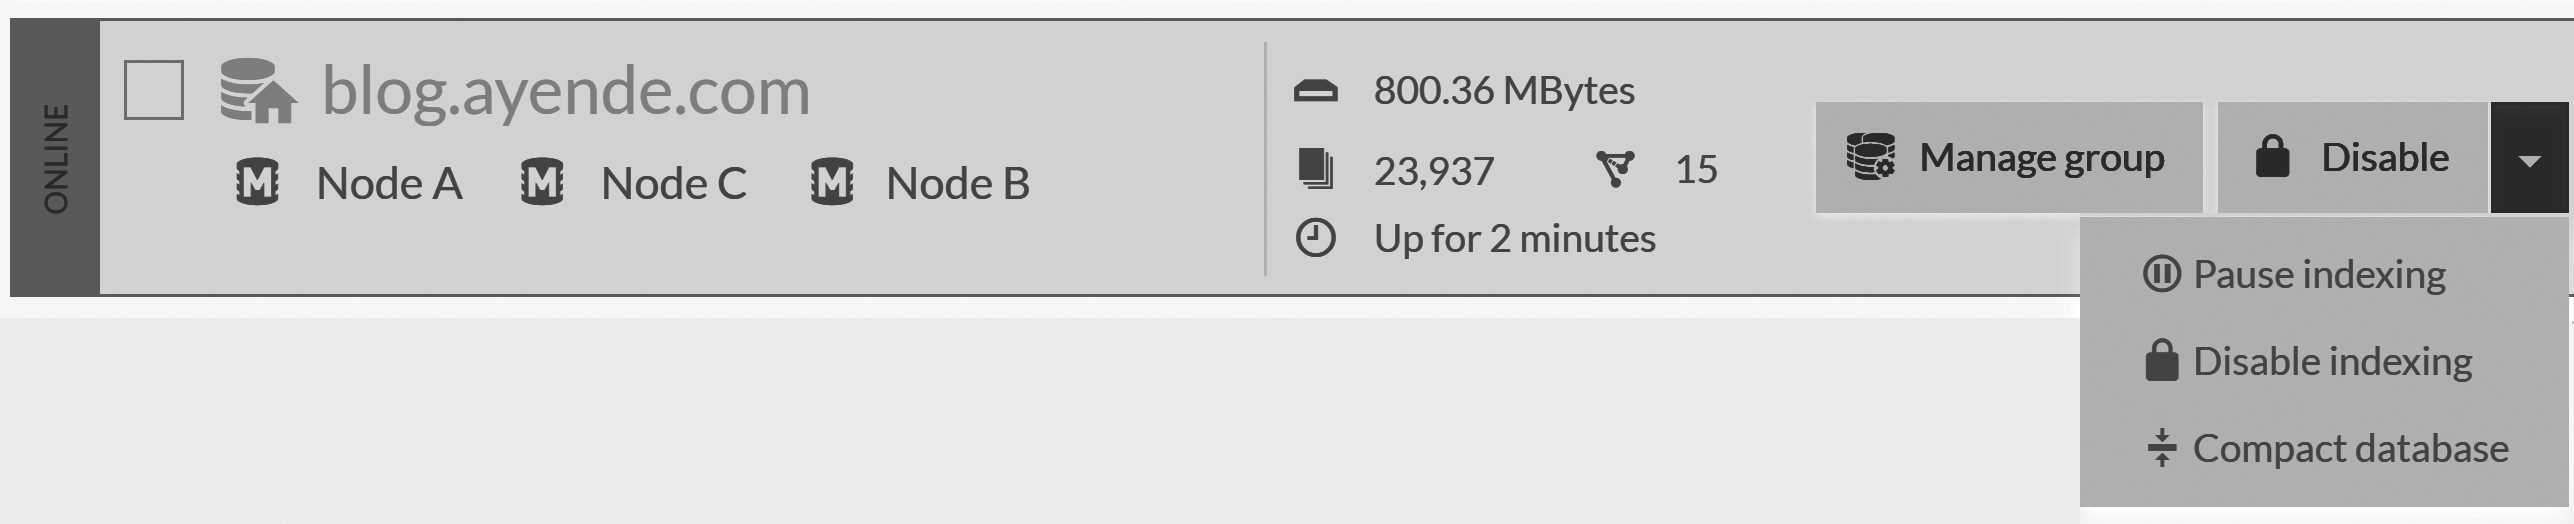
Compaction is an offline process, meaning it will take the database down temporarily (only on the node where you actually run the compaction) and re-create the database files from scratch. Note that this has the effect of reading and writing the entire database and can cause a significant amount of I/O. The process also requires enough disk space to create the compacted database clone in addition to the current database.
Compaction reserves no additional free space from the operating system and can arrange the data on disk in a more optimal way. But unless you have an explicit need for the disk space that this process will free up, it's probably best to leave well enough alone. After all, RavenDB is designed run off as little operational overhead as possible, and managing the data on disk is one of its primary tasks. Any free space inside the data file is already going to be reused by RavenDB, so manual compaction is typically not worth the time.
Troubleshooting connection issues
After talking at length about disk I/O, let's turn our eyes to other I/O sources. In particular, the network which is well-known for being a troublesome and finicky beast in this arena.
Actually delving into all the things that can go wrong in the modern network environment will take multiple books, so I'm going to assume that you're at least familiar with the usual concepts.
The common network issues with RavenDB include:
- Firewalls, both at the network and machine level - Remember that RavenDB uses two ports for communication: one for
HTTP(S) and one for TCP communication. If you didn't explicitly use the configuration
ServerUrl.Tcp, RavenDB will use a dynamic port, which works inside a data center. In the cloud, for example, you'll instead need to set a fixed port and define the firewall rules to allow it. - Latency - If you're deploying in a geo-distributed manner or have high latency between nodes, you'll need to
account for it in the RavenDB configuration. The setting
Cluster.ElectionTimeoutInMscontrols this behavior and is set to 300 ms by default. Note that this setting is meant for nodes deployed in the same data center, so you'll need to set it to a higher value on other configurations. Replication between database instances on different nodes isn't too sensitive to delays and was designed for deployment in high-latency situations, so you won't need to change anything there. - Intrusive middleboxes - In many environments, a network connection goes through multiple network appliances, often called middleboxes. These can be firewalls, intrusion detection systems, WAN optimizers, load balancers, etc. The problem with these middleboxes is that they often add behavior (and even modify the payload) which can result in unexpected results. Because RavenDB is almost always deployed in a secure configuration while in production, the communication to and from the server is encrypted and cannot be modified. This reduces the number of times that a network appliance can apply a transformation to the TCP connection and break things.
- SSL termination - A special case of a middlebox is the SSL-terminating appliance. This is when a client uses SSL to connect to the endpoint, where the SSL connection is terminated and a plain HTTP connection is made from the appliance to RavenDB. This process is only possible when RavenDB is run without security — authentication requires a client certificate to reach the RavenDB server, which obviously cannot happen if the SSL connection was terminated at the appliance level.
- TLS downgrade - Some appliances can only accept certain versions of SSL/TLS connections. RavenDB requires you to use TLS 1.2 to connect and will show an error if a connection is attempted using TLS 1.0 or 1.1.
Troubleshooting issues on the network usually means using low-level tools, such as packet inspectors likes WireShark. While I'm not
going to go into the details of such tools, I want to point out that in many cases — especially for resolving issues in TLS/SSL connections — using openssl s_client3
can be much easier. The full command is:
$ openssl s_client -connect a.oren.ravendb.run:443 \ -cert client.pem -key client.pem.
The output of this command can tell you quite a lot about the connection. In particular, it can tell you whether the client successfully created a secured connection to the server, mutually authenticated and which certificates were used by either side. This command is a good way to pinpoint or rule out common issues at the beginning of your troubleshooting search.
Internal, external and multiple IPs
When you run on your own hardware, the situation is pretty simple: Your server has one IP address to listen to and that clients will use to talk to it. But when you run in the cloud, things get more complicated. Your server has both an internal IP to listen to (such as 172.31.25.240) and a public IP (such as 52.9.72.38)4.
The server can't actually bind to 52.9.72.38, because it isn't directly exposed to the network. Instead, any
connection to this IP will be routed to the server by the cloud's network appliances. This leads to an interesting
problem, because the server needs to bind to an IP address so it can listen to incoming packets. This is the logic behind the ServerUrl and PublicServerUrl configuration settings.
Normally, you'll want to set the ServerUrl to 0.0.0.0:443 to have RavenDB bind to all available network interfaces. However, the server often needs to tell clients and other servers how to talk to it, so we also need to provide the server with its publicly visible details. This is where the PublicServerUrl setting (as well as PublicServerUrl.Tcp) come into play. It's important to remember to calibrate this setting properly — or else the server will tell clients to use its internal IP, which the outside world can't reach. (You'll usually establish this configuration during your initial setup. But if you're doing things manually, it can be easier to forget this step.)
RavenDB uses HTTPS for securing the communication, which means we also validate that the hostname used matches the
hostname on the certificate. Issues can occur if you attempt to connect to the server using a different hostname. For example, if your certificate was issued for a.oren.ravendb.run, any connection made with https://rvn-srv-01 will fail, due to this hostname mismatch. On the client side, you can ignore this validation step, whether from the browser or client API (although doing so is not recommended). But on the server side, RavenDB will always validate the hostname, so it must match the certificate's hostname for any server-to-server communication.
The Admin JavaScript console
We've already covered quite a few of the ways that RavenDB externalizes its state and lets you poke around inside the server. Yet even beyond everything described above, RavenDB contains another option that's very powerful. As they say, with great power comes great responsibility.
Here's what you do: In the RavenDB Studio, go to Manage Server and then Admin JS Console. You can see how this looks in Figure 16.10.
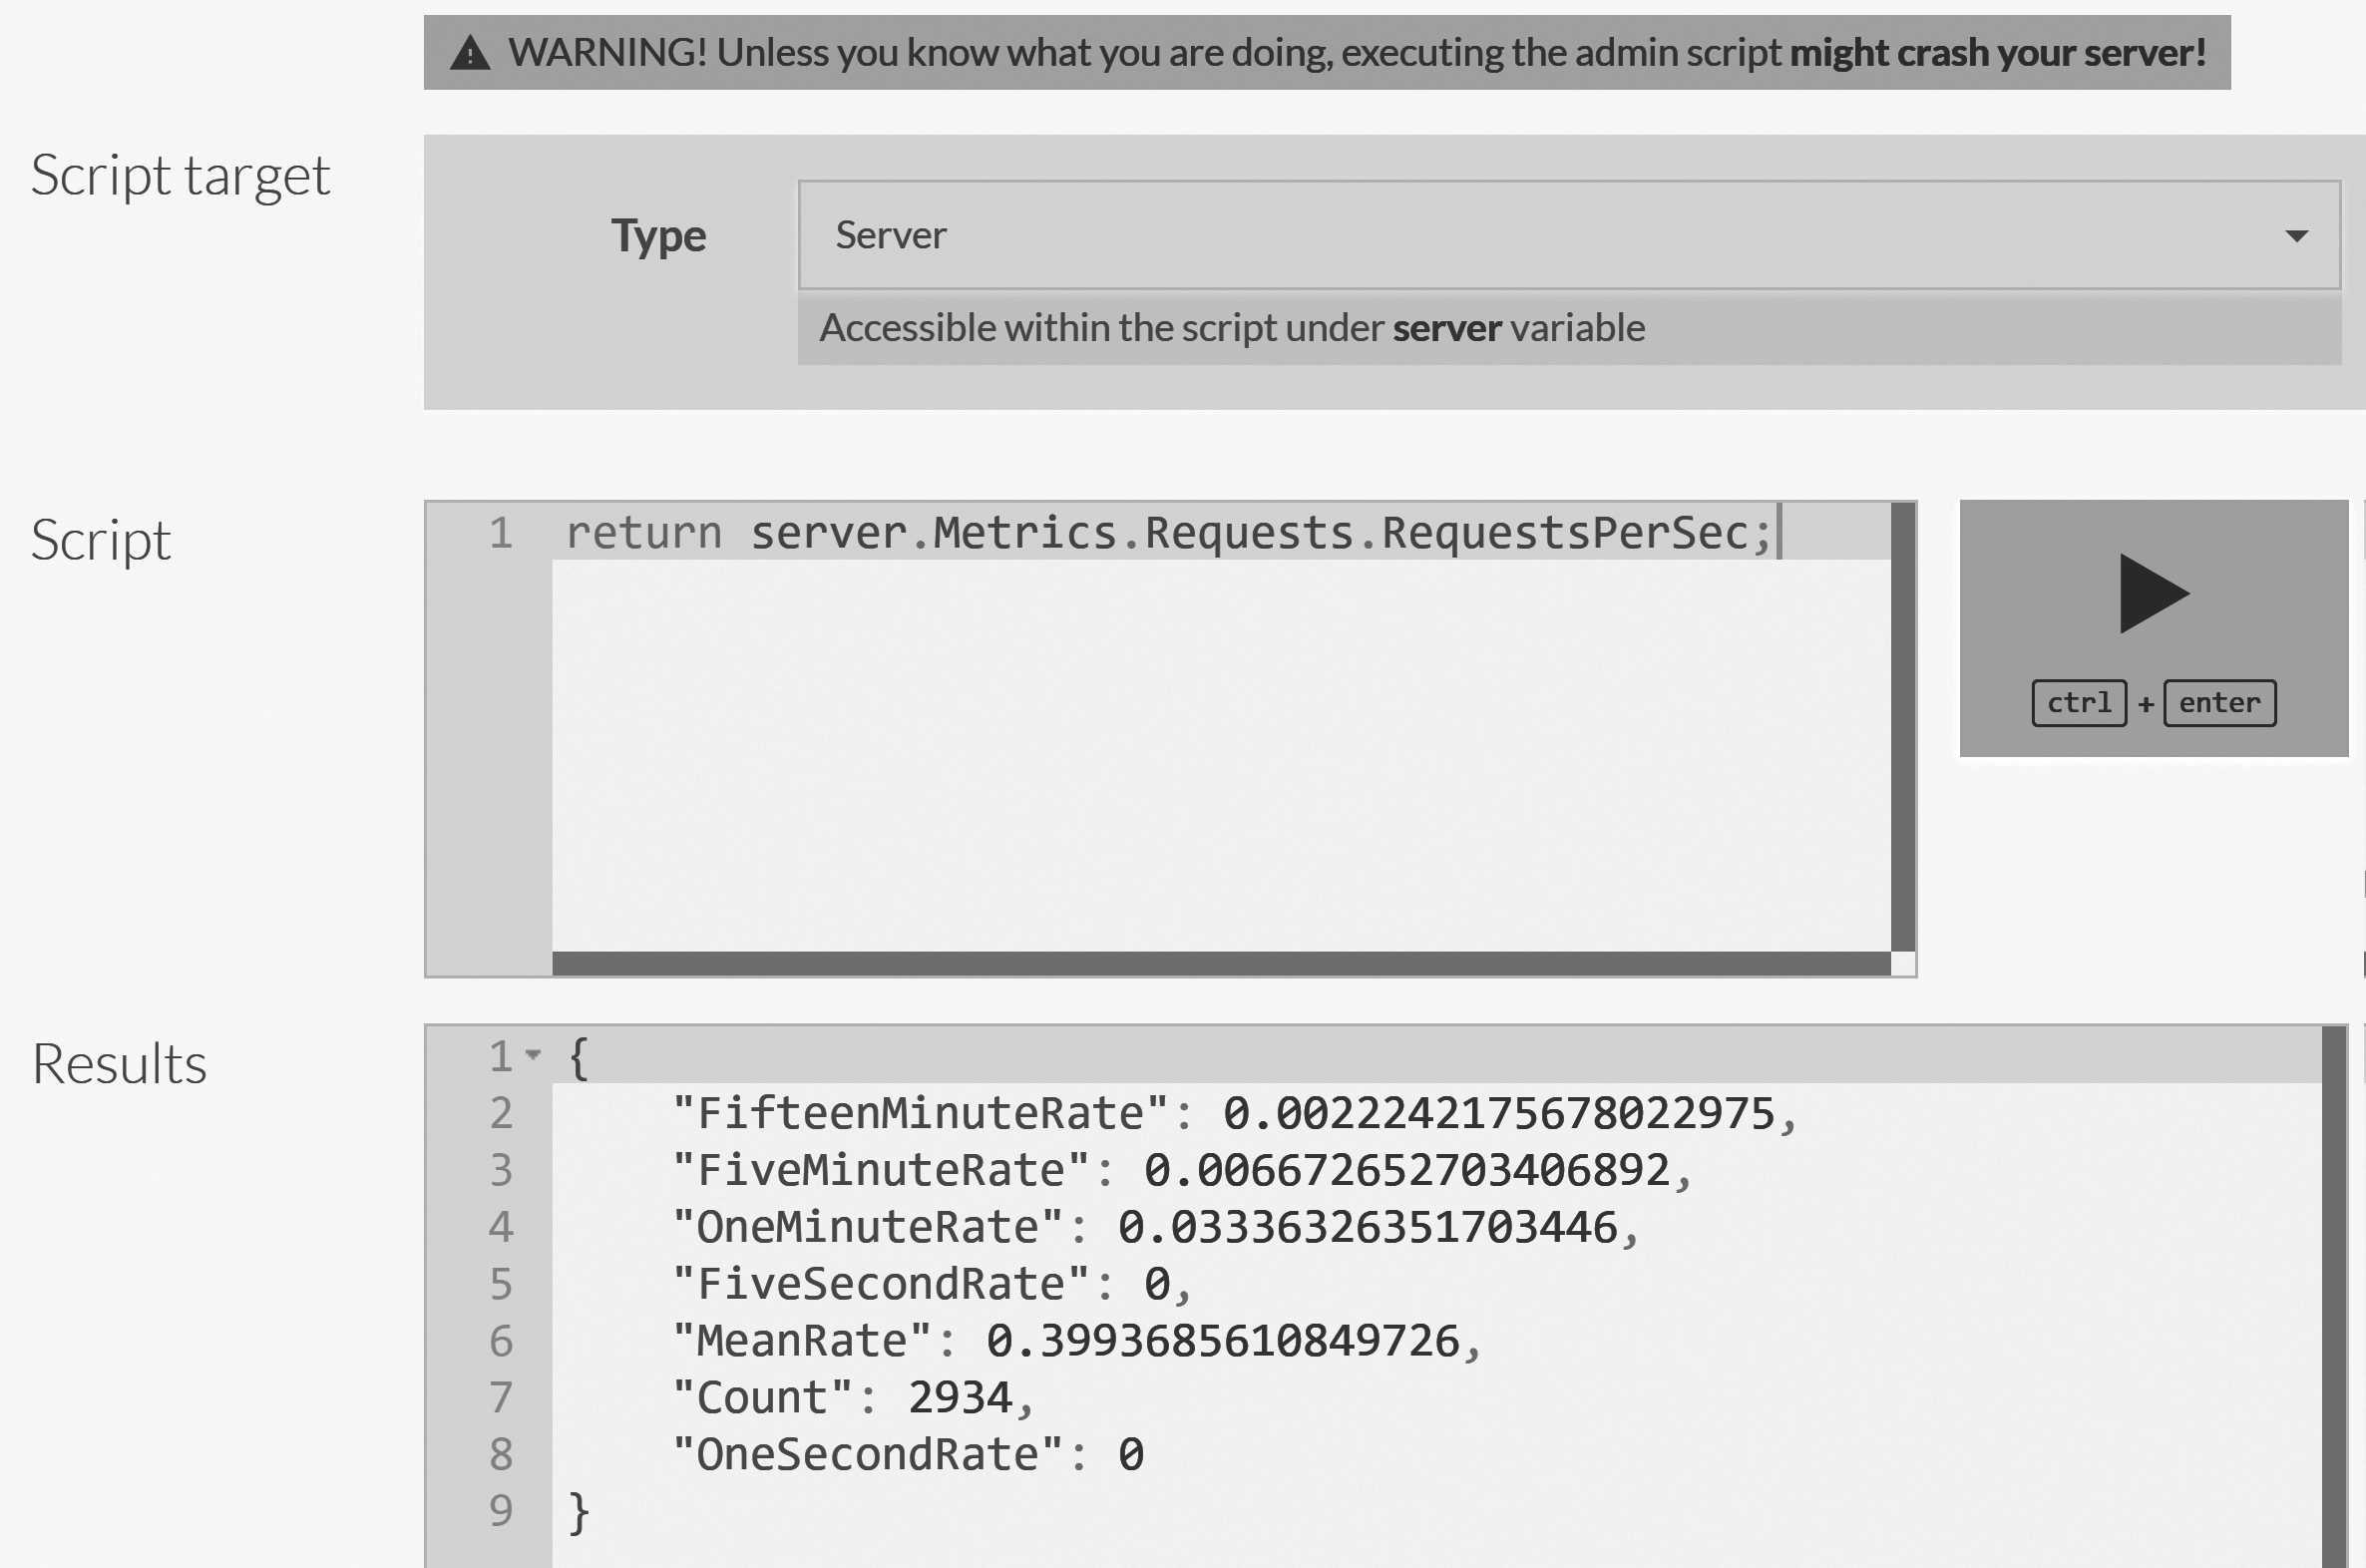
This console unlocks a way to run scripts inside the server itself, giving you full access to anything going on inside. Figure 16.10 shows how we can use this process to retrieve data from the server. But much more is possible: You can also mutate the state of the server, including calling methods and interfering with the internal state.
The Admin JS Console comes with no safety net, nor a harness. You are absolutely able to do things there that would crash the
server or merely stop it from accepting additional requests. (This option is available to those who are experts in the internals of RavenDB. There's no documentation available on the API specifically — but there's also no promise of the compatibility of your scripts between releases.) This tool is mostly meant to be used during support incidents, when you'll get directions for which scripts to run from a RavenDB support engineer, and when the ability to make changes to the server on the fly is invaluable. Otherwise, we don't recommend touching this tool in production. Nonetheless, it's always available via rvn admin-channel, which can connect to a running instance of RavenDB and perform operations directly from inside the server, bypassing the network layer.
The rvn tool was mentioned briefly before, but I think it's time to talk about it now in more depth, as it's part of a larger disaster recovery strategy for RavenDB.
Disaster recovery strategies
RavenDB is used in mission-critical systems and holds valuable information. Part of the very core of its design is to consider failure modes and reactions to them. There have been quite a few of such failures that we took into account, including both hardware issues and losing the admin certificate to your RavenDB instances.
Maximize survivability: Run on a cluster, and avoid single points of failure.
At a minimum — if you care about being up at all — you should always run RavenDB in a multi-node cluster. Running RavenDB on a single node is something that should only be done during development or testing. In fact, all of RavenDB's high-availability features assume that you have multiple nodes to function.
Using the same logic, try to avoid having any single points of failure, such as a single SAN that all the nodes use for storing their data. If the SAN is down, then the entire cluster is down.
It goes without saying that you should always develop a proper backup strategy (see the next chapter, dedicated to this topic). But just having backups isn't enough. If you have a large database, even the time it takes to copy the backed-up data to the machine can take hours. Instead, you need multiple layers of defense to ensure that you'll always be online.
The first layer is running in a multi-node cluster and ensuring that each database has a high-enough replication factor to survive the loss of a node or two. The exact value of this replication factor depends on the size of your cluster and the importance of your data. The more important the data and the continued operation of the system, the more resources you should use.
The next layer of defense is having an offsite clone of the data. This is usually defined using external replication and is meant to serve as a live server that holds all your data — allowing you to manually fail over to it if you happen to lose all the nodes in the cluster.
Paranoia? You mean common sense.
For high-value production systems, paranoia is just the way things are. You don't necessarily have to follow all the suggestions in this section. But know that we're safeguarding systems that must always be up and that seek to survive even the most unlikely scenarios.
We also know that a cost is associated with such duplicated measures (an offsite hot node, backups, additional nodes in the cluster, etc). Part of any operations team's job is to weigh these costs against the acceptable level of risk to see if they're worth it. At some point, the risks become negligible and the costs prohibitive. To my knowledge, no one has yet set up a server farm on the moon to handle the case of a thermonuclear war, for example. You need to make your own determination in the matter.
One other thing to note on this topic is that you can also set up a delay in external replication, which can give you time to react if you happen to run a query that modifies data that shouldn't get across the cluster.
Admin access without the admin certificate
Imagine trying to get into your house, only to discover that you lost your keys. The same can happen to RavenDB if you lose the admin certificate. A basic example is when an employee goes on vacation — with the admin client certificate locked on his or her machine. You don't have access to the certificate, but you desperately need to perform some admin operation. What can you do?
RavenDB follows a simple rule: If you have admin or root privileges on the box, then you can access RavenDB. As a root user,
you have a few options available to help you access RavenDB: You can use your root privileges to get the server certificate
that RavenDB itself is using to run. This certificate can also be used for client authentication.
If you authenticate as a client using the server's own certificate, RavenDB will always give you
a full unrestricted access to the server.
In other words, if you can access the machine RavenDB is running on as root or administrator, then you can get the certificate that RavenDB is using and then access RavenDB directly as admin. At this point, you could generate a new admin client certificate or perform any other action as needed.
The security of allowing root access
This kind of access raises the obvious question: Isn't this a security risk? Why should it be so easy for a root user to have full access to RavenDB?
The answer is that it doesn't actually matter. If attackers have enough privileges to run as root users, then they also have enough access to do whatever else they want — inject code into the RavenDB process, read and write to its memory, etc.
If there's no protection from the root user, then there's no point in making the operations team work any harder than necessary.
In addition to getting the server certificate for client authentication, there's also the option to use the rvn tool. This tool is used for various tasks (such as the rvn offline-operation described in Chapter 13 for encrypting the server store) and in this case can also be run in the rvn admin-channel mode to use a named pipe for connecting to the server.
In particular, you can run commands that let you do thing like add a new client certificate, dig into statistics, force a GC collection, restart the server and even access the Admin JS Console discussed earlier in this chapter.
The rvn admin-channel uses a named pipe, controlled by the operating system permissions. Only those with root or admin privileges
and the user who is running the RavenDB process have access to this named pipe and can send such commands to RavenDB.
Dealing with data corruption
Hardware does break and disks do fail — eventually, entropy will take us all. Yet I'll assume that you can get over the depressing reality of the previous statement and actually want to do something when such things happen. The scenario we'll deal with in this case is a bad sector, hardware failure or something similar that resulted in data corruption of the RavenDB on-disk files.
RavenDB uses hashing to ensure that the data has been successfully written to the disk. This allows RavenDB to detect if there have been unexpected changes to the data.5 In this way, data corruption can be detected and handled early on — before it has the chance to spread. RavenDB will mark a database with such an error as corrupted and shut it down.
If you're running in a cluster, the usual — and easiest — way to handle such a scenario is to replace the hard disk on the faulty node and just let RavenDB replicate the data back to the node. But if you don't have the data on another node, you might need to take additional steps.
The Voron.Recovery tool is designed for such cases. This tool reads a RavenDB database (data file and journals) and goes over all the data — one byte at a time. It doesn't rely on a file's structure and assumes that the file is corrupted. It tries to recover as much data as possible by going over the raw data with a fine-tooth comb.
The output of this process is a set of .ravendump files (gzipped json, essentially) that contain all the recovered data as well as
the list of errors that the tool encountered. You can import these .ravendump files into a new database to recover the documents.
Routine maintenance
By design, RavenDB is not one to require regular maintenance. For most things, RavenDB will quite happily clean up after itself and not require any human involvement in the process. Monitoring is the way to go here, to only alert you when things arise that RavenDB can't recover from automatically. Things like running out of disk space or having an index definition that failed to index too many documents are two examples of such issues. For those, you need monitoring, alerts and a human in the loop to actually fix things.
Most tasks, such as backups and ETL jobs, are defined only once and then executed by the cluster on its own, without the need for a babysitter.
The most common task for an admin to do, in fact, is to go over the cluster's own to-do list and see whether all its tasks are still relevant. For example, the number of subscriptions on a database may be very large, but many of them haven't had a client connecting to them for weeks or months. This doesn't actually hurt anything, but it can be nice to trim such subscriptions to make it easier to see what's actually going on in your cluster.
Summary
In this chapter, we've gone through the core details of keeping RavenDB running in production. A lot of these details involve simply setting up proper monitoring and alerts — if something happens that RavenDB isn't actually able to fix on its own. RavenDB doesn't need a lot of regular maintenance, as it does most things automatically. However, when something does break, you want to have a red light flashing somewhere and a person to investigate it and help RavenDB recover. As a result, RavenDB offers a lot of features aimed specifically at enabling proper monitoring and externalizing its internal state to make the operations team's job easier.
The first topic we discussed was SNMP monitoring, a protocol that is used by all operational monitoring systems to check the state of servers and network services. RavenDB supports this protocol and exposes quite a bit of data to it for observation and analysis. You also have more detailed information available in JSON endpoints, giving you multiple ways to access and act on the data.
Beyond exposing its state, RavenDB also continuously performs analysis on itself and makes decisions on what to do. In most cases, these actions are internal and reflect RavenDB's automatic adjustment to the environment. There are also cases where RavenDB will issue alerts and performance hints for the operators to look at.
The performance hints in particular should interest the operations team, because they can usually head off the system taking a problematic direction. The alerts are of more immediate concern, of course, but at that point the problem is likely more severe. Because the performance hints that show up today point to problems that may happen in a few weeks or months, it's best to take advantage of this lead time and take action on them early — before you have a crisis on your hands.
Routine monitoring of your application will let your team know when something is ... off. But you might need more information. So, we looked at how to figure out what's going on inside the server. Tools such as admin logs and traffic watch give you immediate insight into what's going on. Admin logs can enable logs to run on the fly, even if logging was disabled in the server configuration. Traffic watch lets you to observe the incoming requests and monitor latency and usage.
In most troubleshooting scenarios, however, you'll head directly to the debug info package. This view captures a snapshot of all the details about the running server (or even the entire cluster) and puts them in a single zip file. The package makes it very convenient to explore the entire state of RavenDB at a given point in time. It's also useful to first capture the state of the server, then restart it (which fixes most problems). You can do offline analysis of the package at your leisure, while restoring the system to full functionality as soon as possible.
We then discussed network and connection issues. We went over some common problems that may occur in your environment, in
particular related to firewalls and other network appliances. The openssl s_client command is very useful in such scenarios,
since it gives you a simple place to start your investigation. We also discussed internal and external IPs and how to resolve a potential identity crisis for RavenDB when running in such an environment. We have to explicitly tell RavenDB what IP to bind to and what hostname to direct clients to for their server connections. Otherwise we're likely to create confusion.
The Admin JS Console is a way for you to run scripts directly inside RavenDB. Here, you can even mutate the internal state of RavenDB (for example, enable logging to a file without having to do a restart), but this access can also be dangerous, since you're literally modifying RavenDB in real time.
The final topic we covered in this chapter is how to deal with disasters. RavenDB was explicitly designed to run in a hostile
environment, where nodes may go down and hardware may fail. We went over several strategies to deal with such cases, mostly
by adding redundancies to handle these failures. There's also the Voron.Recovery tool that can extract data from a partially
corrupted RavenDB database if the hard disk itself has suffered a failure.
Even though we talked about disaster recovery, we haven't yet covered one crucial topic: the backup (and restore) of RavenDB. This is because the backup process is an important topic on its own and deserves a proper forum for discussion. The next chapter is dedicated to backups, and even more important, to how to restore your systems afterward.
-
Simple Network Management Protocol↩
-
All these sizes, as well as the max size of database's growth are configurable, of course.↩
-
Full documentation for this feature can be found in the OpenSSL Cookbook..↩
-
These are real internal and external IPs from one of our AWS machines.↩
-
By default the hash function used is XXHash64, which is non-cryptographic. It doesn't provide any level of authentication. A malicious user that can modify RavenDB's on disk files can update the data and the hash without RavenDB ever knowing. When using an encrypted database, RavenDB uses cryptographic authentication to ensure that the data was modified only by someone who holds the secret encryption key.↩